In our first post, we described a problem that has been quietly undermining security operations for decades: nobody actually knows whether their security telemetry is flowing. Not whether the tools are running, but whether the data is arriving, from every asset, for every source, right now.
We got a lot of responses. Most of them said the same thing: “We have exactly this problem. What do we do about it?”
So let us tell you what we’re doing about it.
Not another dashboard on top of dashboards
Before we describe what SilentPulse is, we should be clear about what it isn’t.
It’s not another SIEM. It doesn’t process your security events. It doesn’t replace your EDR, your firewall, or your log management platform. It doesn’t try to detect threats.
SilentPulse does exactly one thing, and it does it obsessively well: it monitors whether your security monitoring is actually working.
It’s a watchdog for your watchdogs. A health check layer that sits above your entire security telemetry pipeline and continuously validates that every asset you expect to see is actually being seen.
The difference: every asset, individually
This is where SilentPulse fundamentally differs from existing approaches.
Most organizations, if they monitor telemetry health at all, do it at the infrastructure level. They check whether Kafka is running. Whether the Splunk indexer is healthy. Whether the forwarder service is up. And when those checks pass, they assume everything is fine.
But “Kafka is running” doesn’t mean every host is writing to it. “Splunk is healthy” doesn’t mean every expected data source is actually arriving. You can have a perfectly healthy pipeline carrying incomplete data, and you’d never know.
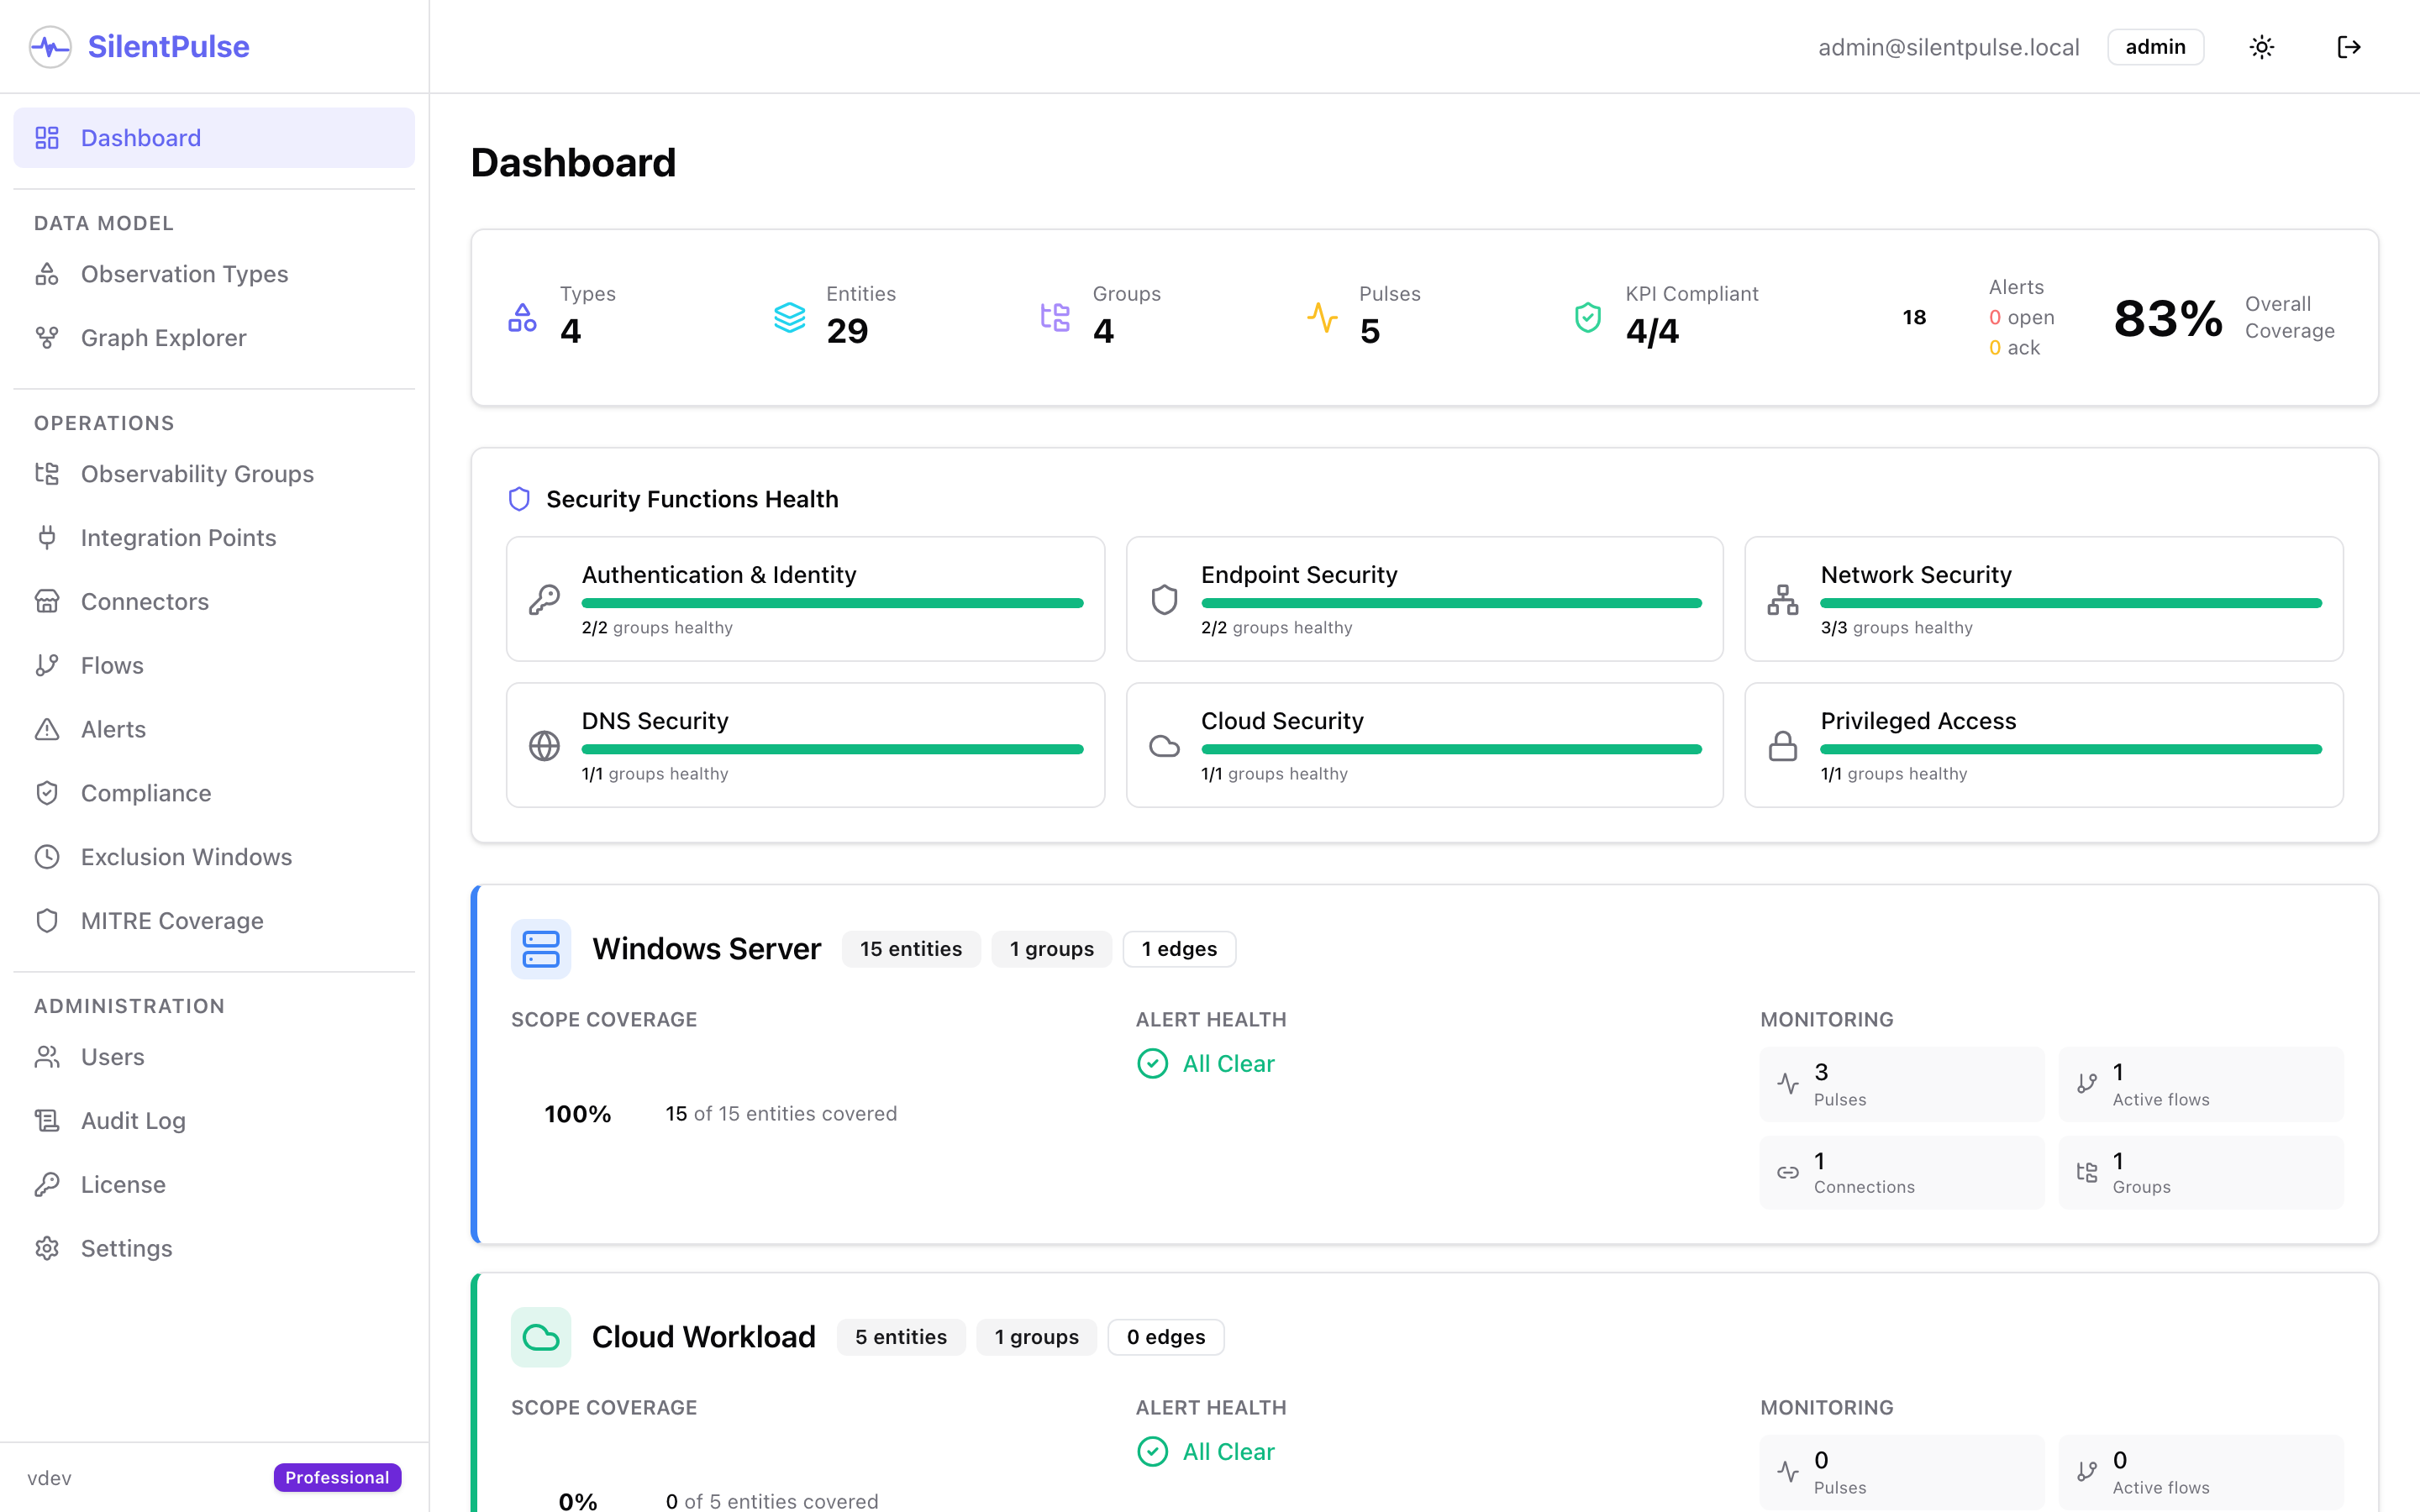
SilentPulse monitors at the individual asset level. Not “is Kafka alive” but “has server-db-prod-017 written authentication logs to the Kafka topic in the last 15 minutes?” Not “is the SIEM ingesting” but “have we seen DNS telemetry from each of the 47 DNS servers we expect to be reporting?”
This is the critical difference. Every host. Every database. Every sensor. Every network device. Individually tracked, individually monitored, individually alerted.
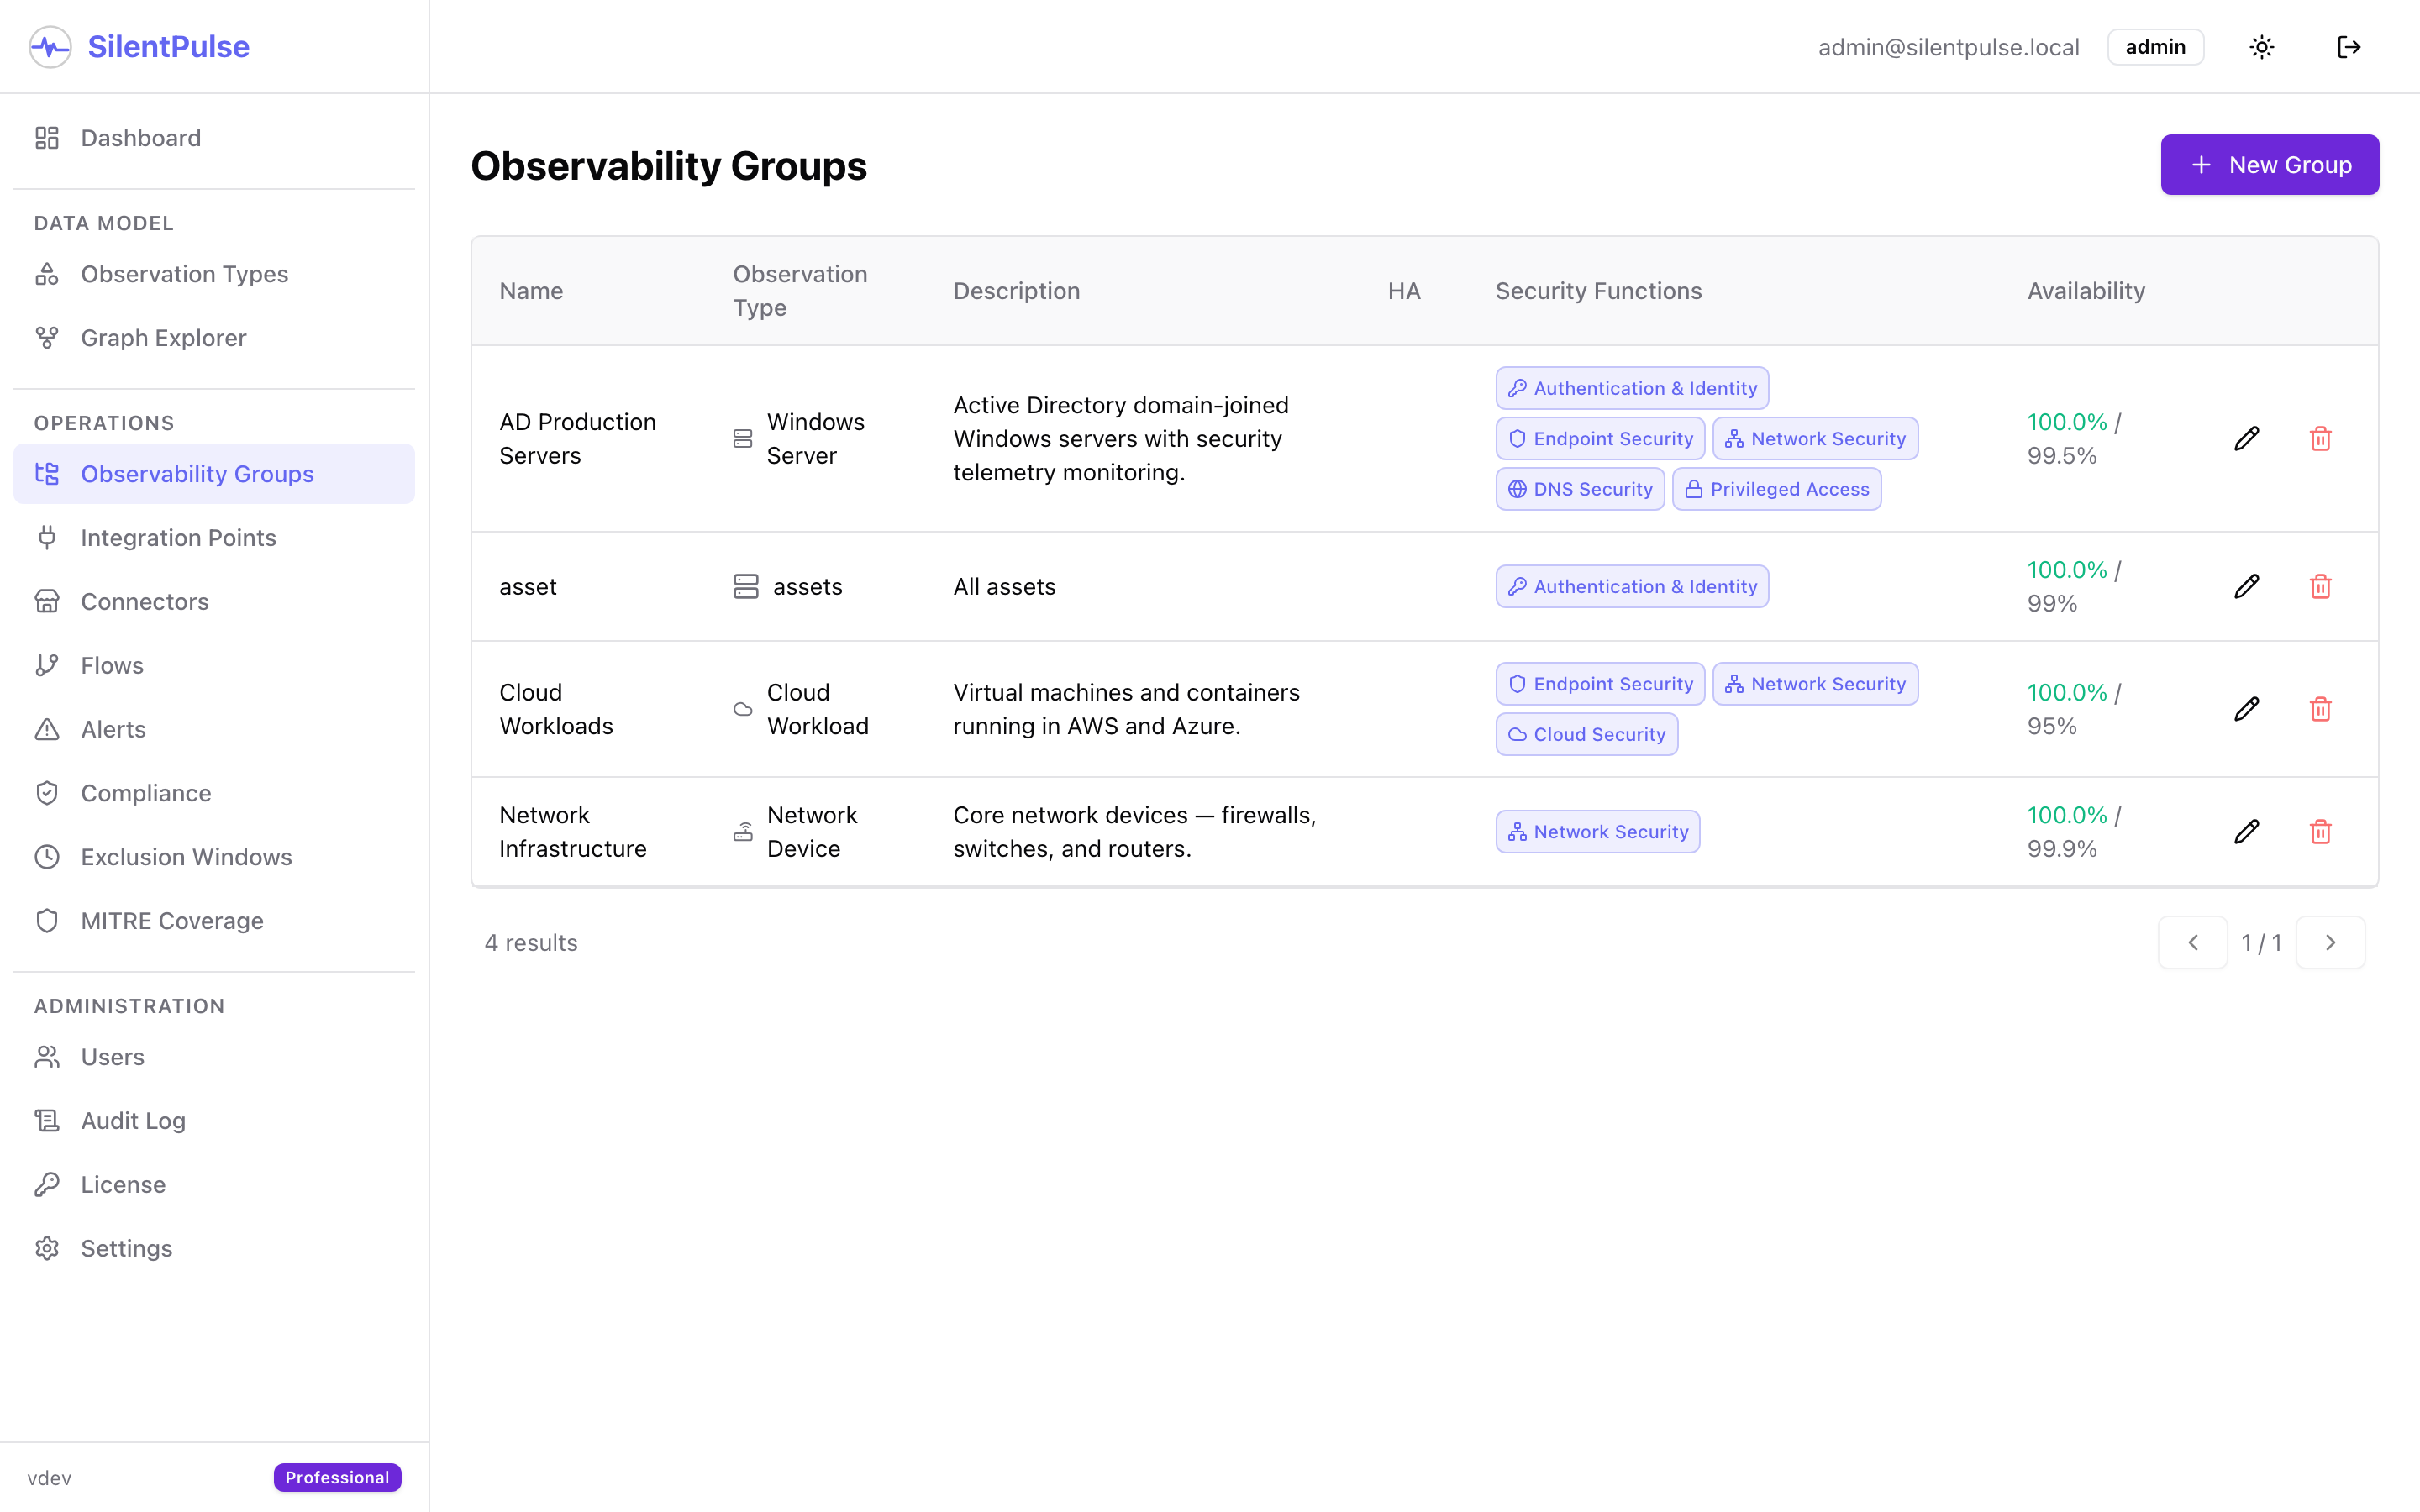
You group your assets by function (servers, databases, IoT sensors, cloud workloads) and map each group to the security functions it supports. When SilentPulse detects a silent asset, it knows exactly which security capabilities are degraded: endpoint detection, authentication monitoring, DNS security, data protection. Not a generic “something is down,” but a precise answer to “what can we no longer detect?”
How it works (without the jargon)
The concept is simple. The execution required solving several hard problems.
You tell SilentPulse what you expect. You define your asset groups: your servers, your databases, your IoT sensors, your cloud workloads. You define what “observability” means for each, including which security data sources should be producing telemetry and from which assets.
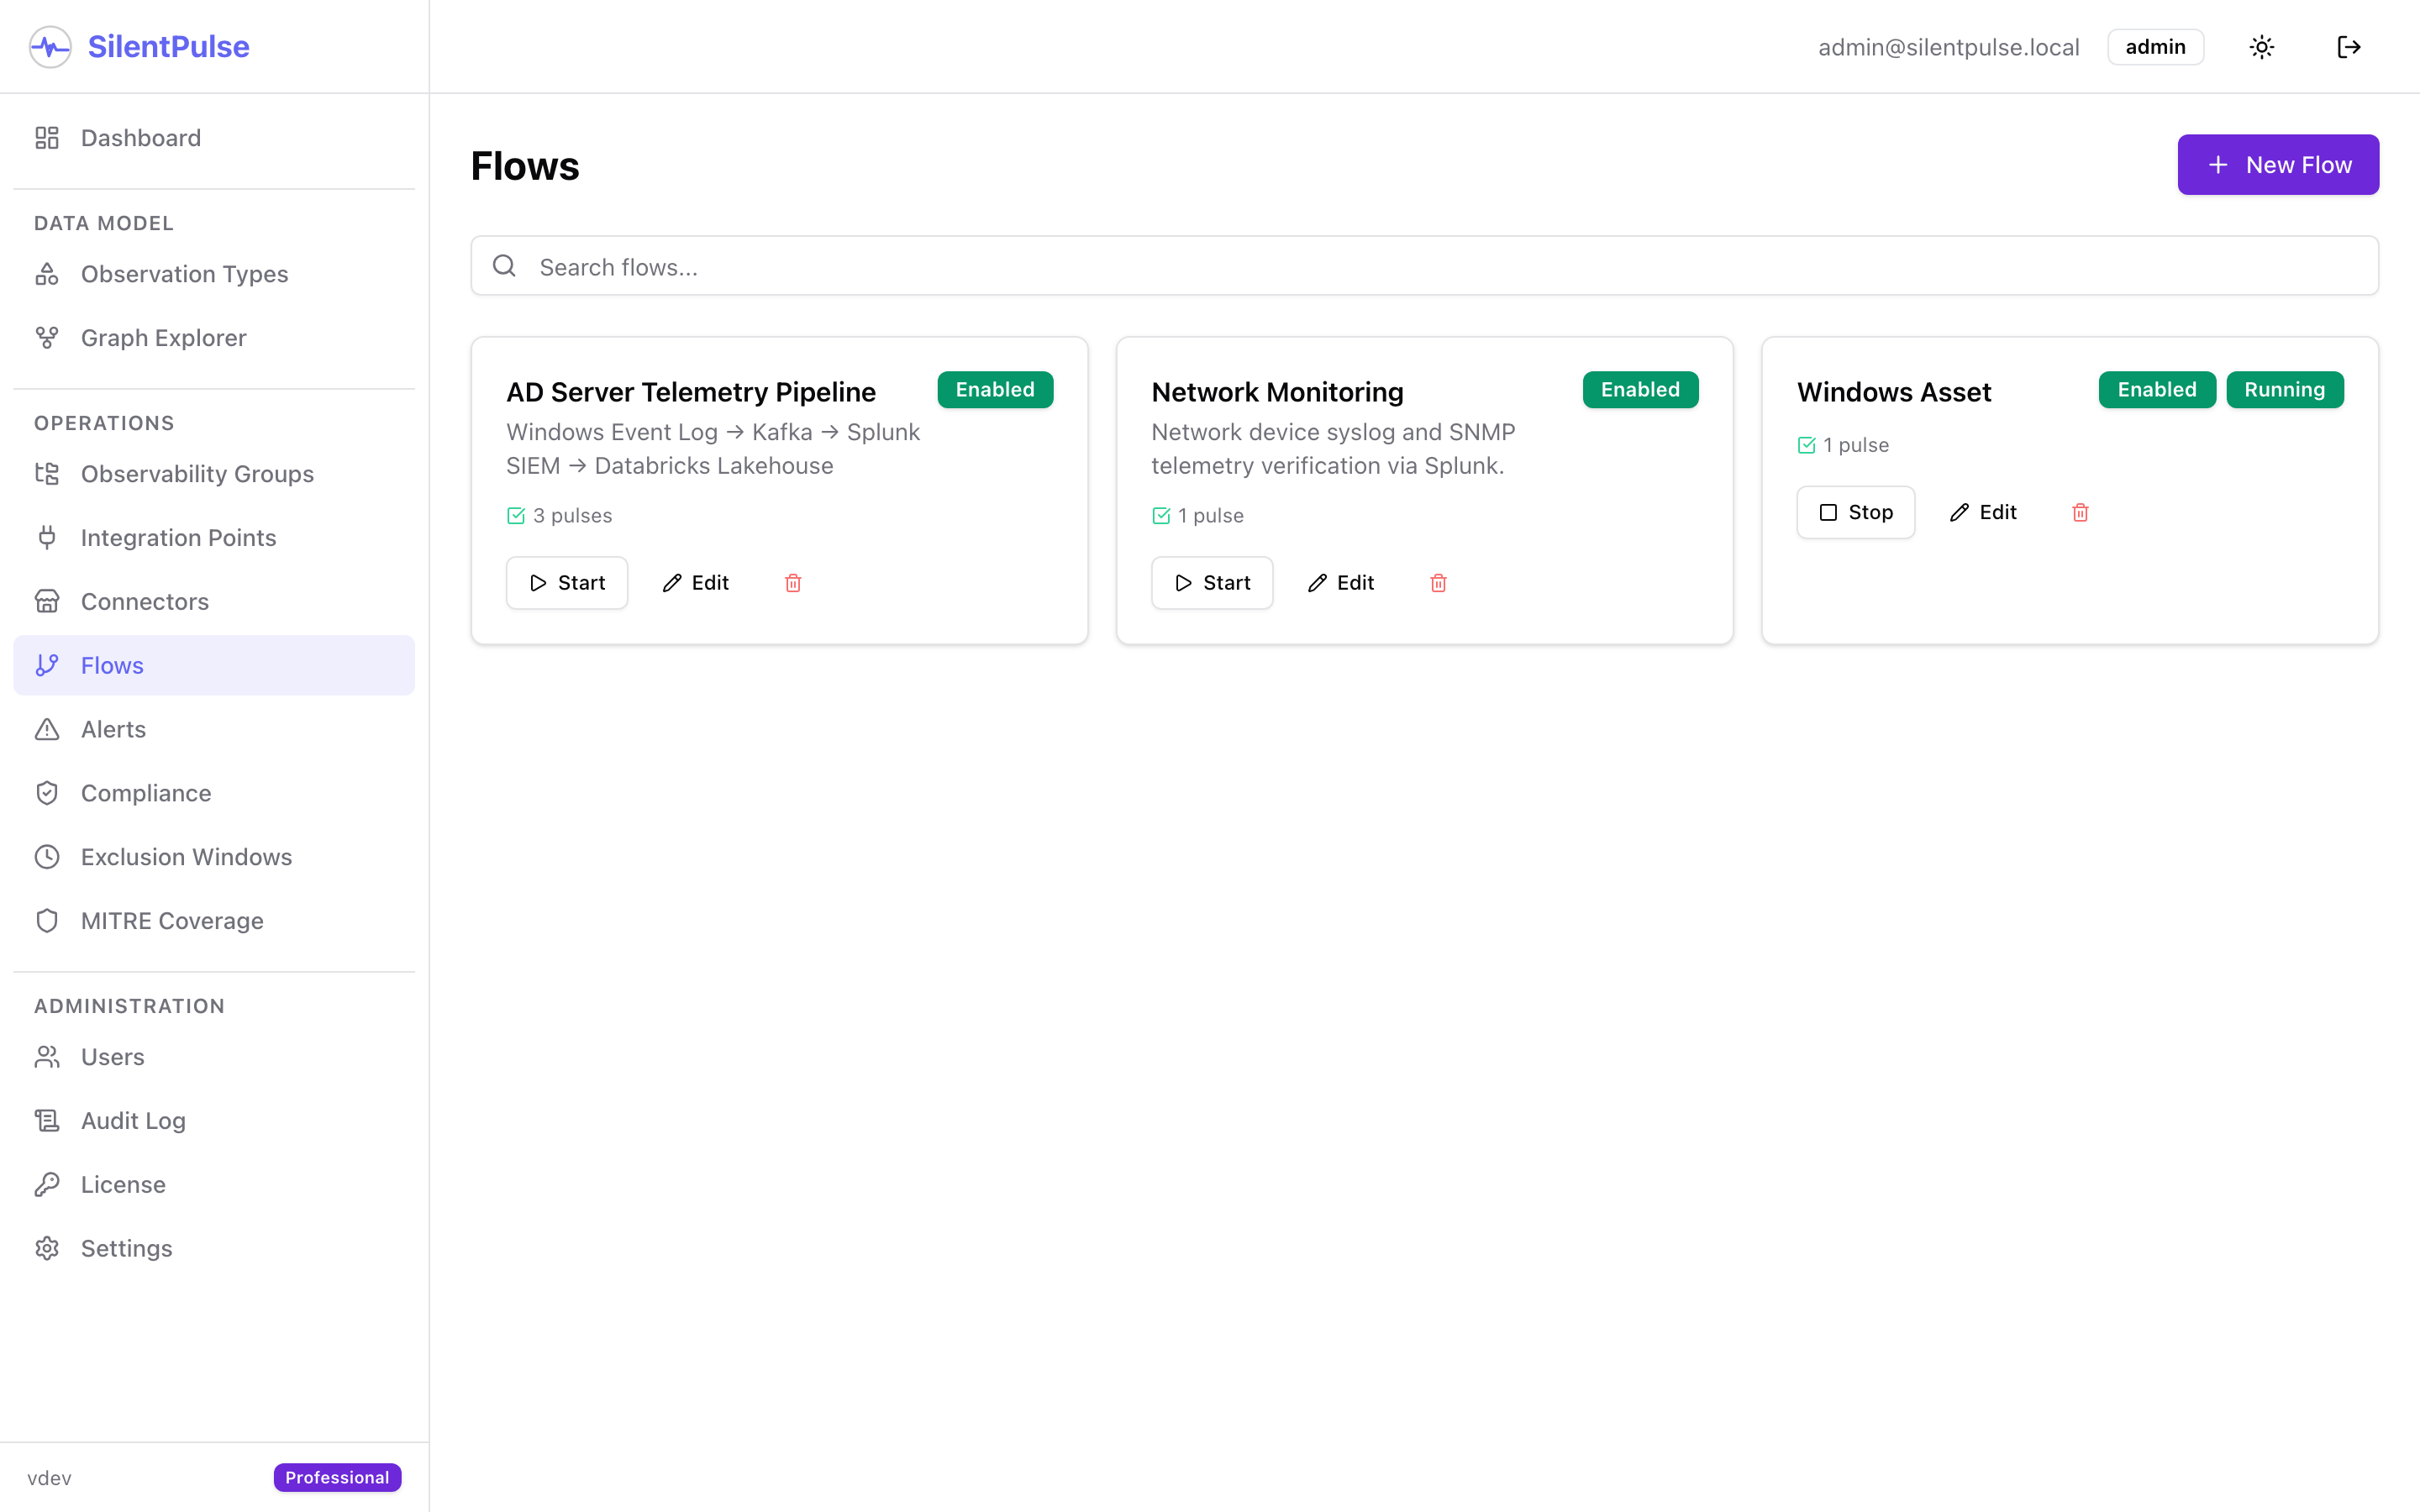
SilentPulse goes and checks. It connects to your existing infrastructure (your SIEM, your log platform, your message queues, your APIs) and asks a simple question: “Have you seen data from this specific asset recently?”
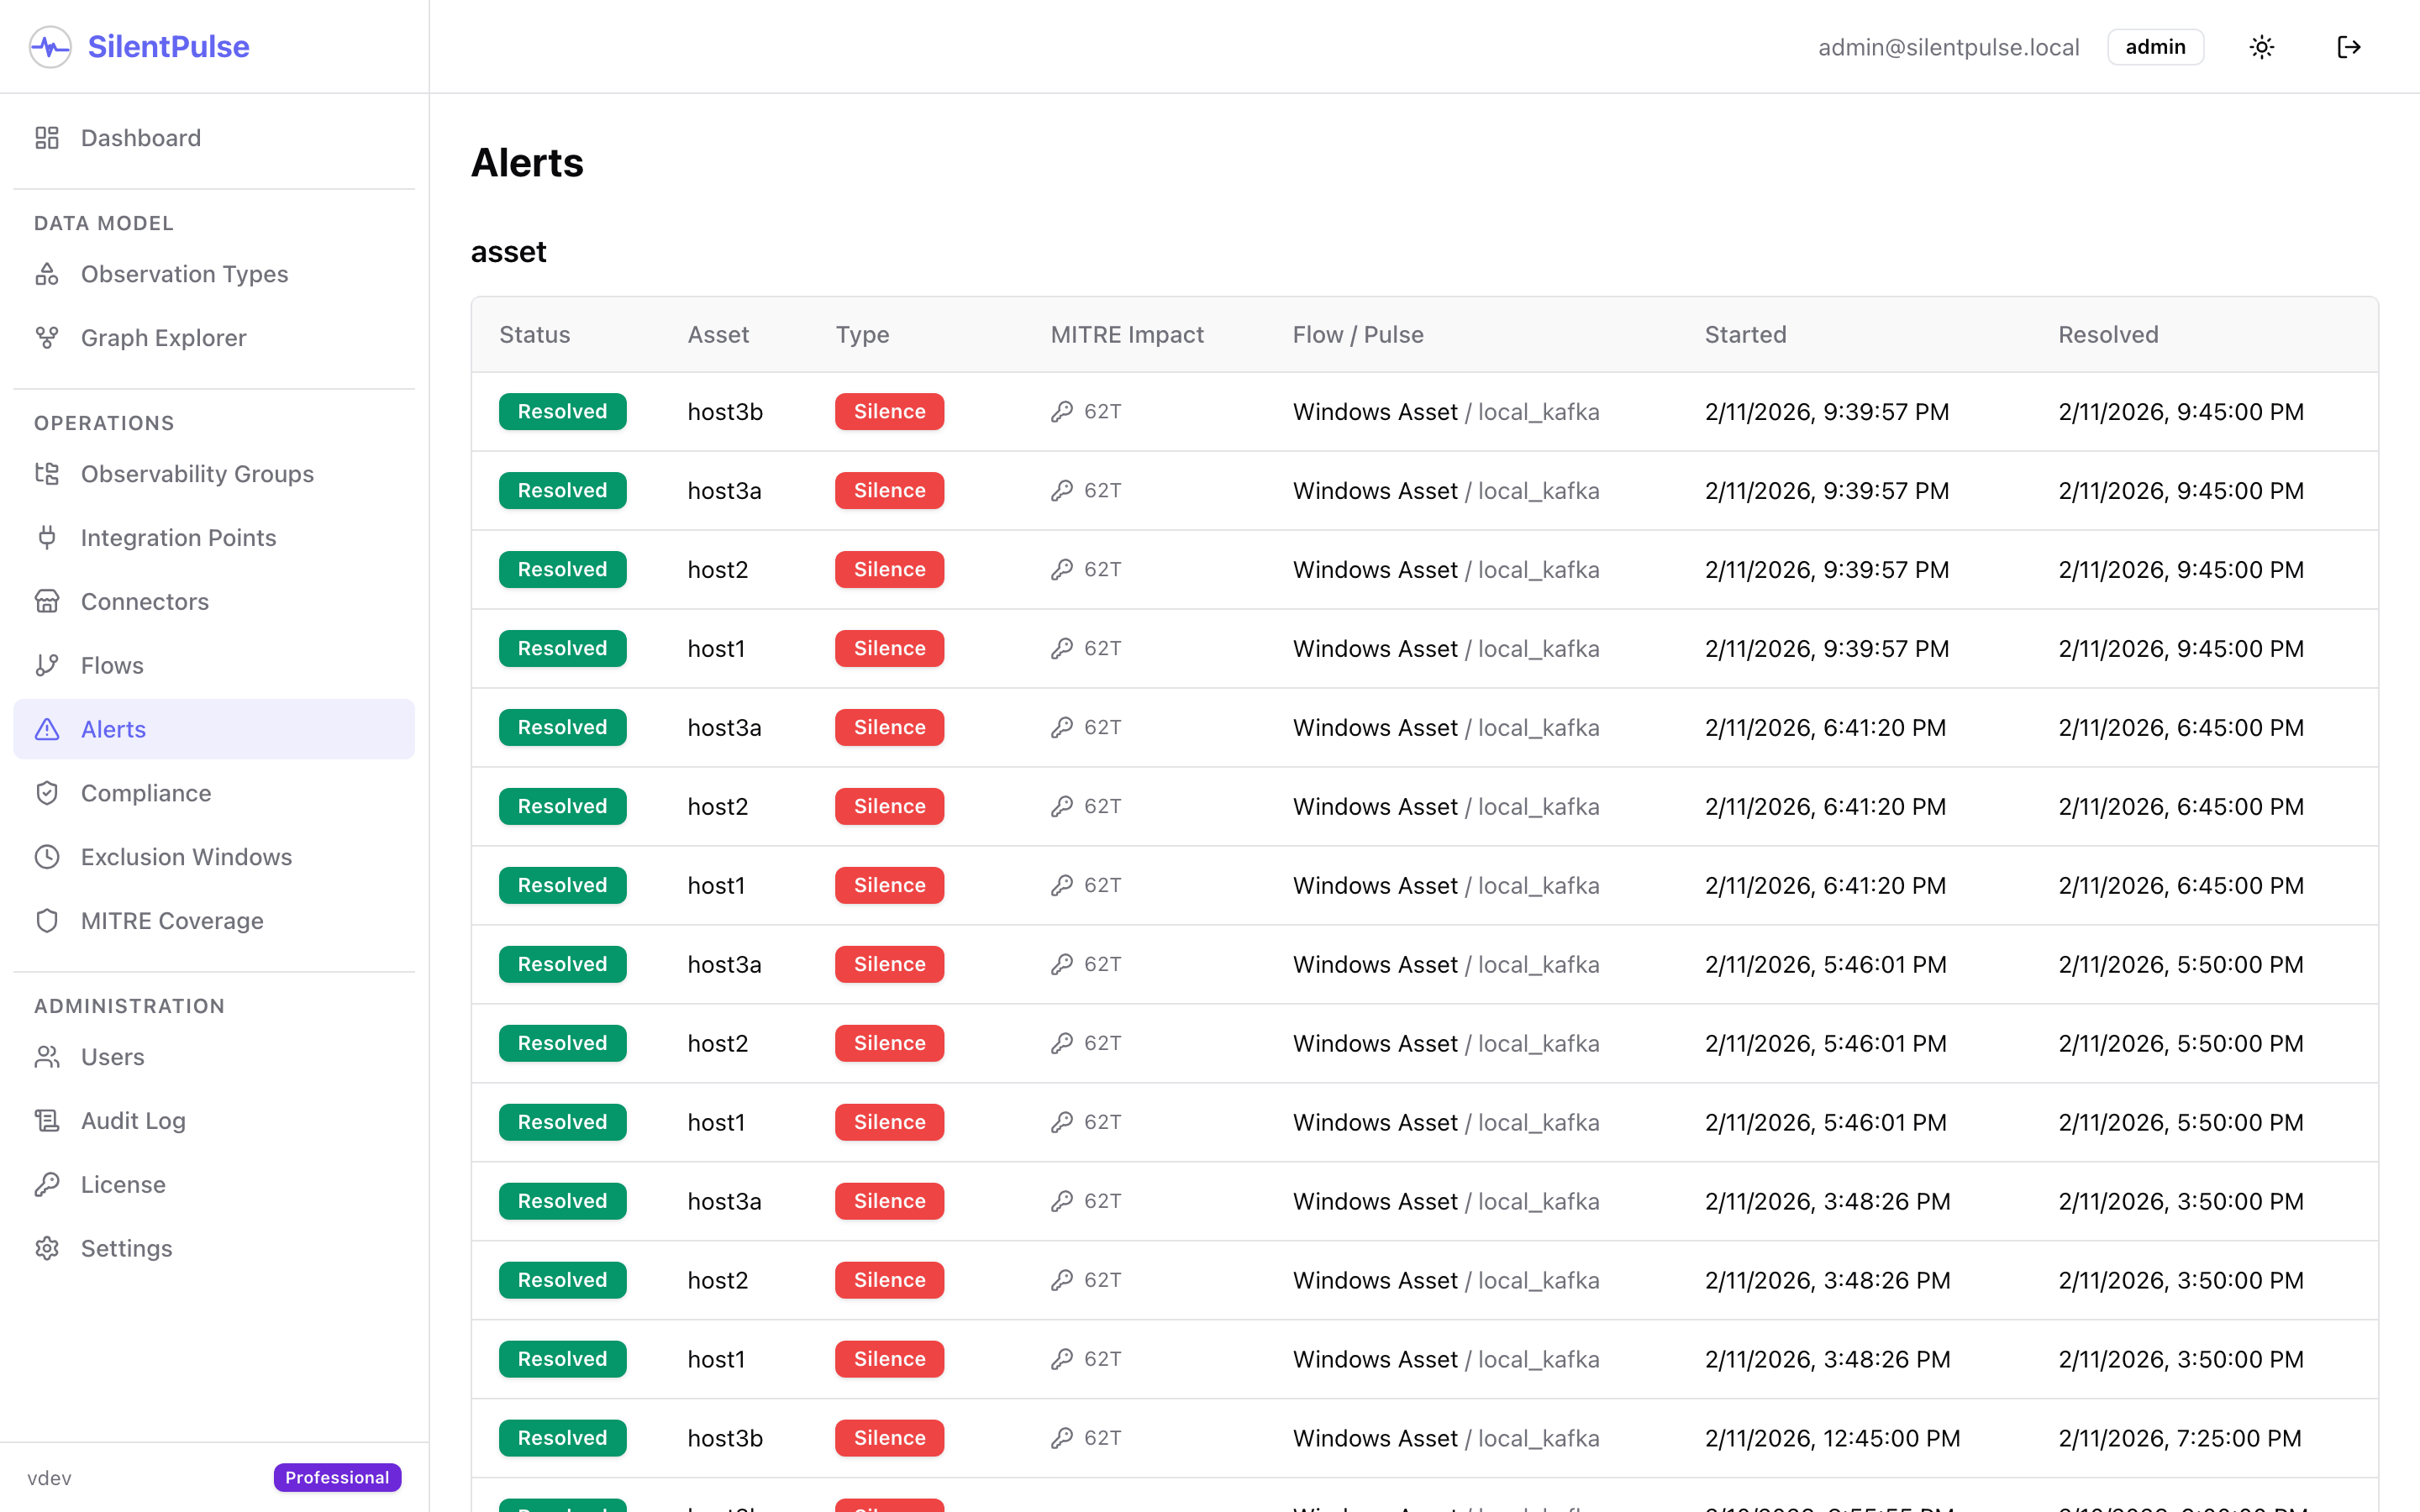
When something goes silent, you know immediately. Not when a quarterly audit catches it. Not during the post-breach investigation. Now. With full context: which asset, which data source, how long it’s been silent, and what detection capabilities are affected.
A use case you’ll recognize
Consider a scenario that plays out in enterprises every single day.
The setup: A hospital network with 2,000 endpoints, 80 servers, and 30 medical IoT devices. They run CrowdStrike for endpoint detection, forward syslogs from network devices to Splunk, and collect authentication logs from Active Directory.
Tuesday, 2:47 AM: A Windows update on three servers in the radiology department causes the CrowdStrike sensor to crash. The servers are online. They respond to pings. They’re in the CMDB. Active Directory shows them as healthy. The Splunk forwarder is still running, but it’s only forwarding system events, not endpoint detection telemetry.
Without SilentPulse: Nobody notices. The SOC sees fewer alerts from that segment, but fewer alerts is good, right? Thirteen days later, during a routine audit, someone notices the gap. By then, an attacker who compromised a radiology workstation on Day 3 has moved laterally across the segment, accessed patient records, and established persistence on two domain controllers.
With SilentPulse: At 3:02 AM, fifteen minutes after the expected check-in window, SilentPulse fires an alert: “3 assets in Radiology Servers group have stopped producing endpoint detection telemetry. Last seen: 2:47 AM. Affected security functions: Endpoint Security, Authentication & Identity. MITRE ATT&CK coverage impact: 23 techniques now unmonitored in this segment.”
The on-call engineer gets a Slack notification. The incident is logged. The sensors are restarted by 4:15 AM. Total blind time: 88 minutes instead of 13 days.
That’s the difference.
Per-asset compliance, not just uptime
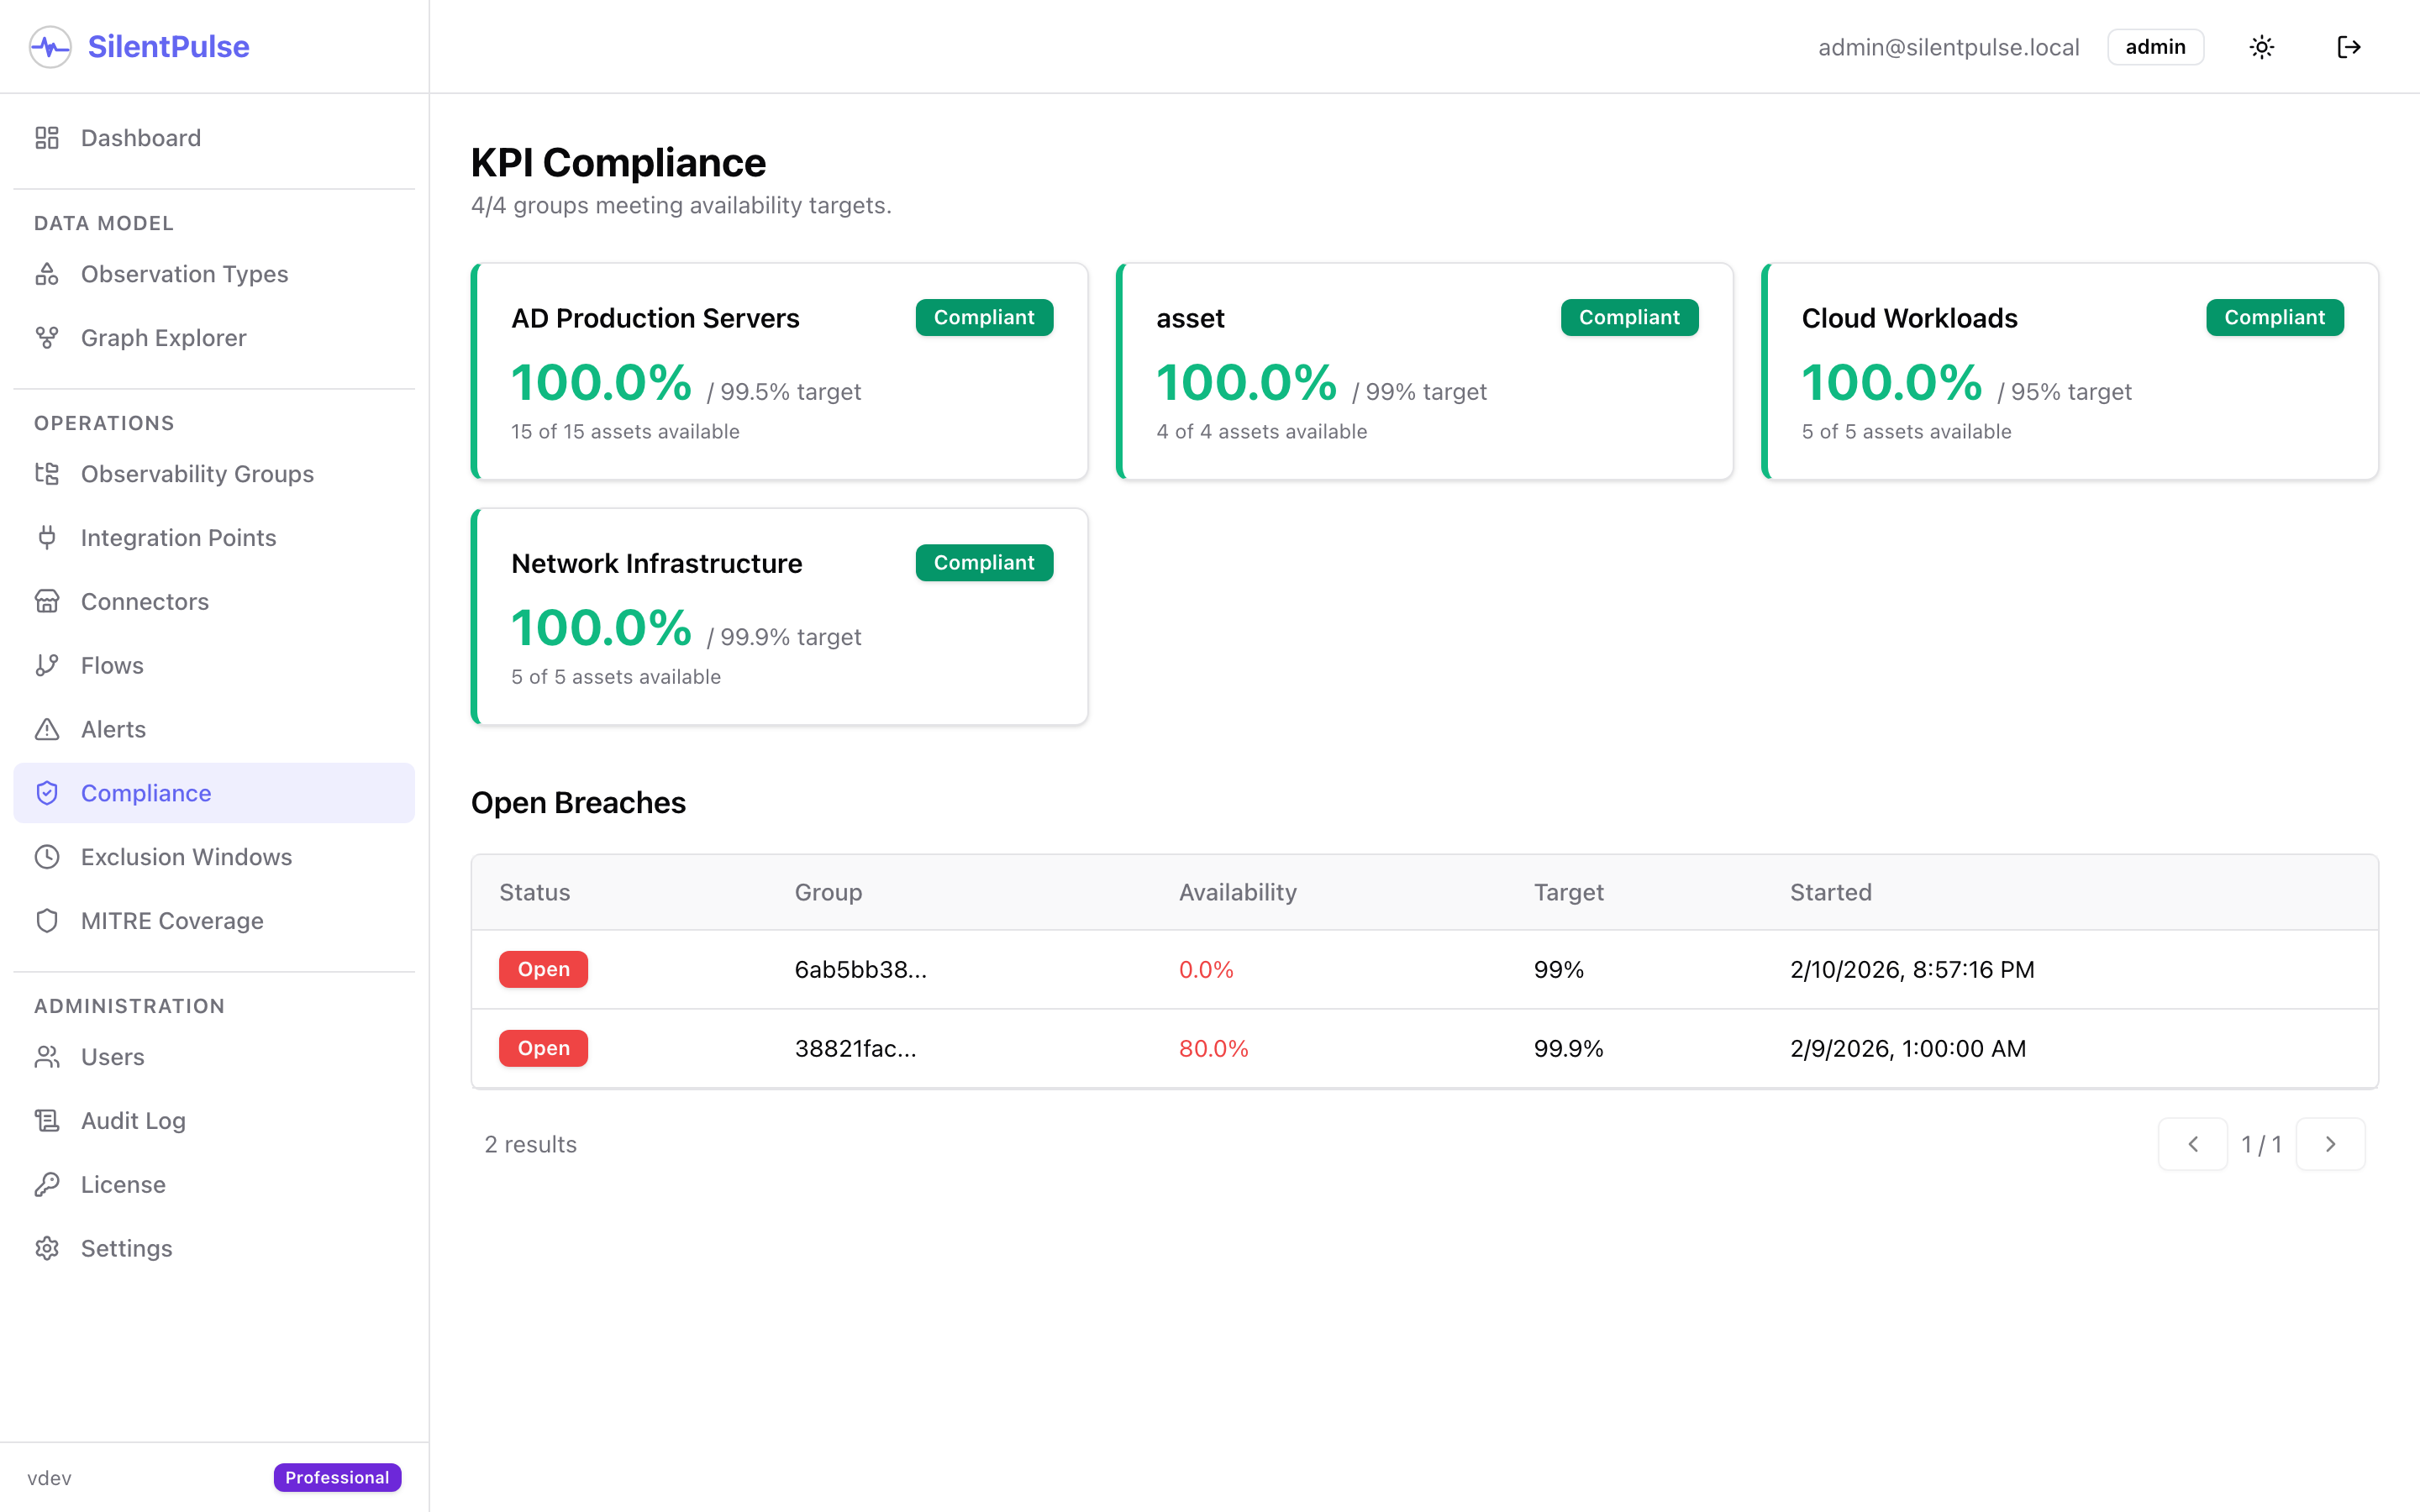
SilentPulse doesn’t just alert on failures. It tracks availability over time against targets you define.
Your SOC committed to 99.5% telemetry availability for critical servers? SilentPulse measures it. Continuously. Per asset group. And when availability dips below target, whether from a sensor crash, a misconfigured firewall rule, or a network partition, it opens a compliance breach with full attribution.
This means you can answer questions that were previously impossible:
- “What was our average endpoint telemetry availability across all servers last quarter?”
- “Which asset group has the most compliance breaches this month?”
- “Are we meeting our SLA for DNS monitoring on the OT network?”
Try answering those with your current tooling.
Connect to anything
Security telemetry doesn’t live in one place. It flows through message brokers, lands in SIEMs, gets archived in data lakehouses, streams through syslog collectors, and surfaces through APIs. Every enterprise has a different mix, and it changes over time.
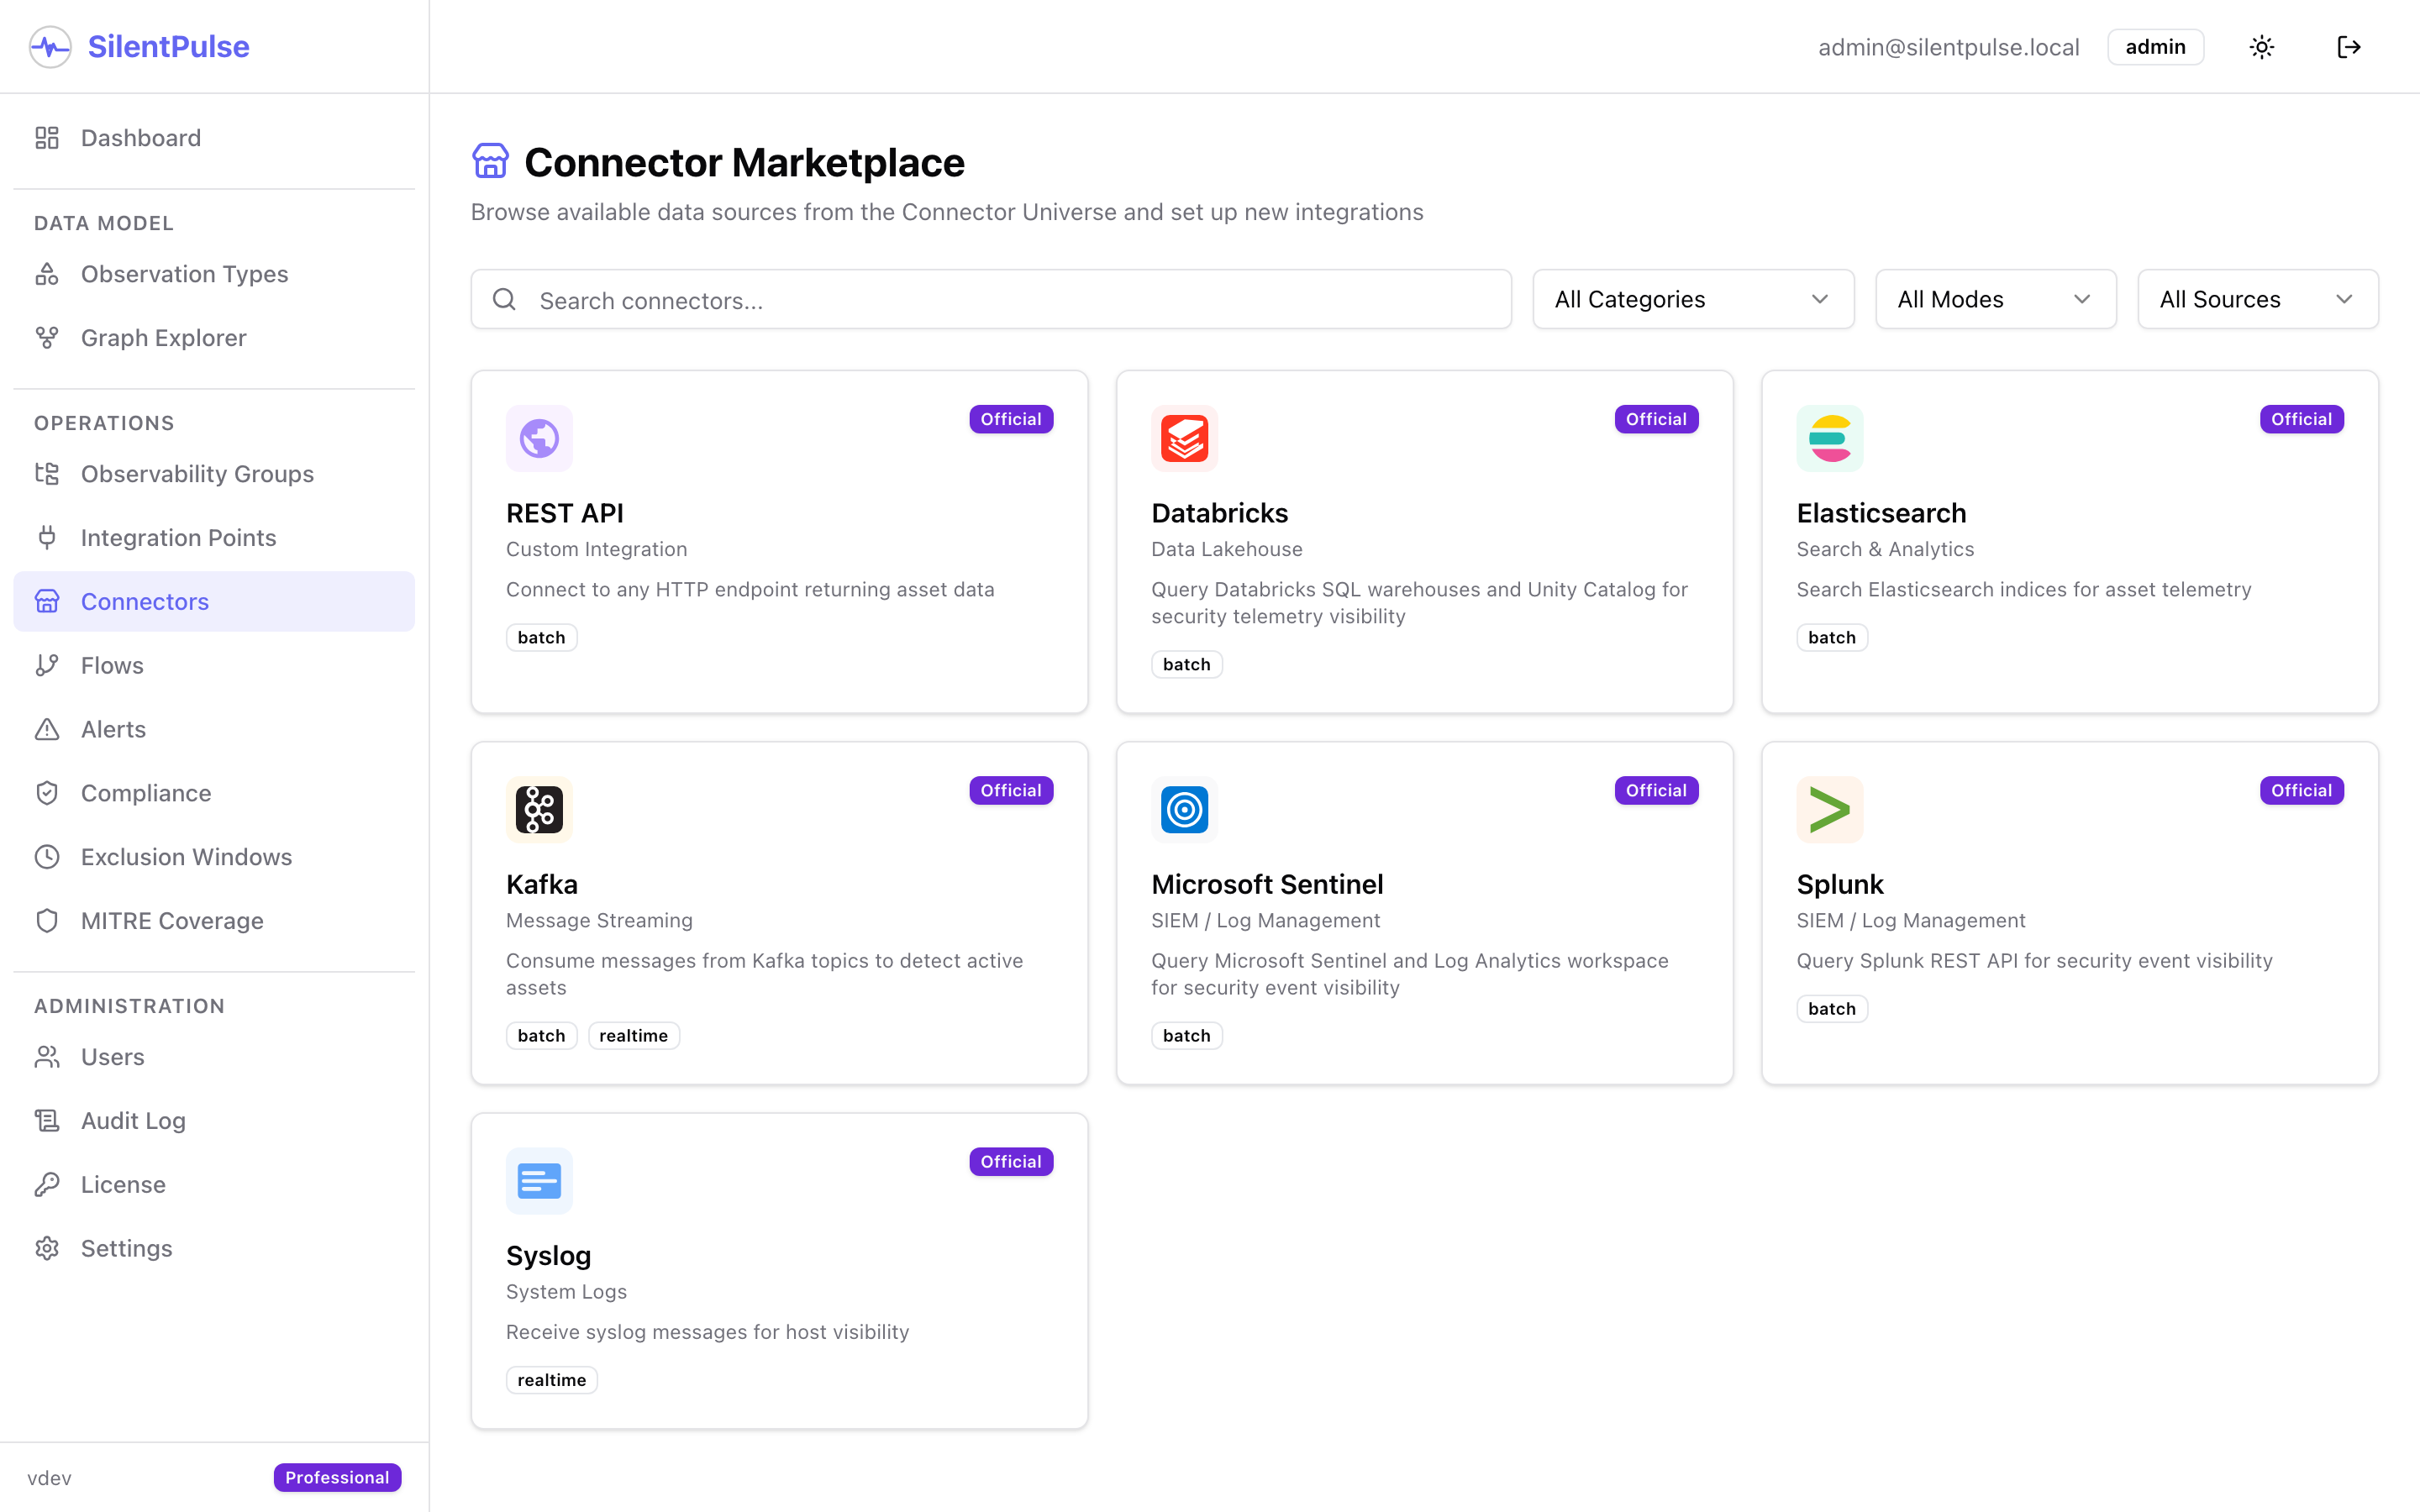
SilentPulse doesn’t care where your data lives. It uses a connector architecture, a marketplace of pluggable integrations, each designed to answer one question about one data source: “Has this specific asset been seen recently?”
Available connectors today:
- Splunk - Query the REST API with SPL. If your EDR events, firewall logs, or authentication data lands in Splunk, SilentPulse can verify that every expected host is present in the index.
- Kafka - Consume directly from Confluent or Apache Kafka topics. Perfect for organizations where security telemetry flows through a streaming pipeline before reaching the SIEM. SilentPulse reads messages, extracts asset identifiers, and tracks which hosts are actively producing.
- Elasticsearch - Search indices for asset-level telemetry. Whether you use Elastic Security, a self-hosted ELK stack, or Elasticsearch as a log backend, SilentPulse queries it.
- Microsoft Sentinel - Query your Log Analytics workspace using KQL. Validate that every Windows endpoint is sending Security Events, that Azure AD sign-in logs are flowing, that your CEF sources are active, all through the native Azure API.
- Databricks - Run SQL against your Unity Catalog and Delta Lake tables. If your security data pipeline feeds a lakehouse architecture for analytics and long-term retention, SilentPulse verifies that data from every expected source is actually arriving.
- Syslog - Receive syslog streams and track which hosts are actively sending. Ideal for network devices, firewalls, and legacy systems that speak RFC 5424.
- REST API - Connect to any HTTP endpoint that returns asset data. The universal fallback for custom data sources, internal tools, or platforms we don’t have a dedicated connector for yet.
Every connector supports batch mode (scheduled polling), and streaming connectors like Kafka and Syslog also support real-time mode. Poll your Splunk instance every 5 minutes. Consume from a Kafka topic continuously. Schedule SQL queries against your Databricks warehouse on a cadence that makes sense. Mix and match within the same deployment: one flow can use Kafka in real time while another queries Elasticsearch every 10 minutes.
Because the connector architecture is open, building a new one is straightforward. If your telemetry data is accessible, SilentPulse can monitor it.
Designed for reality, not for demos
We’ve seen too many security tools that look amazing in a sales demo and fall apart in production. SilentPulse is designed around the messy reality of enterprise environments:
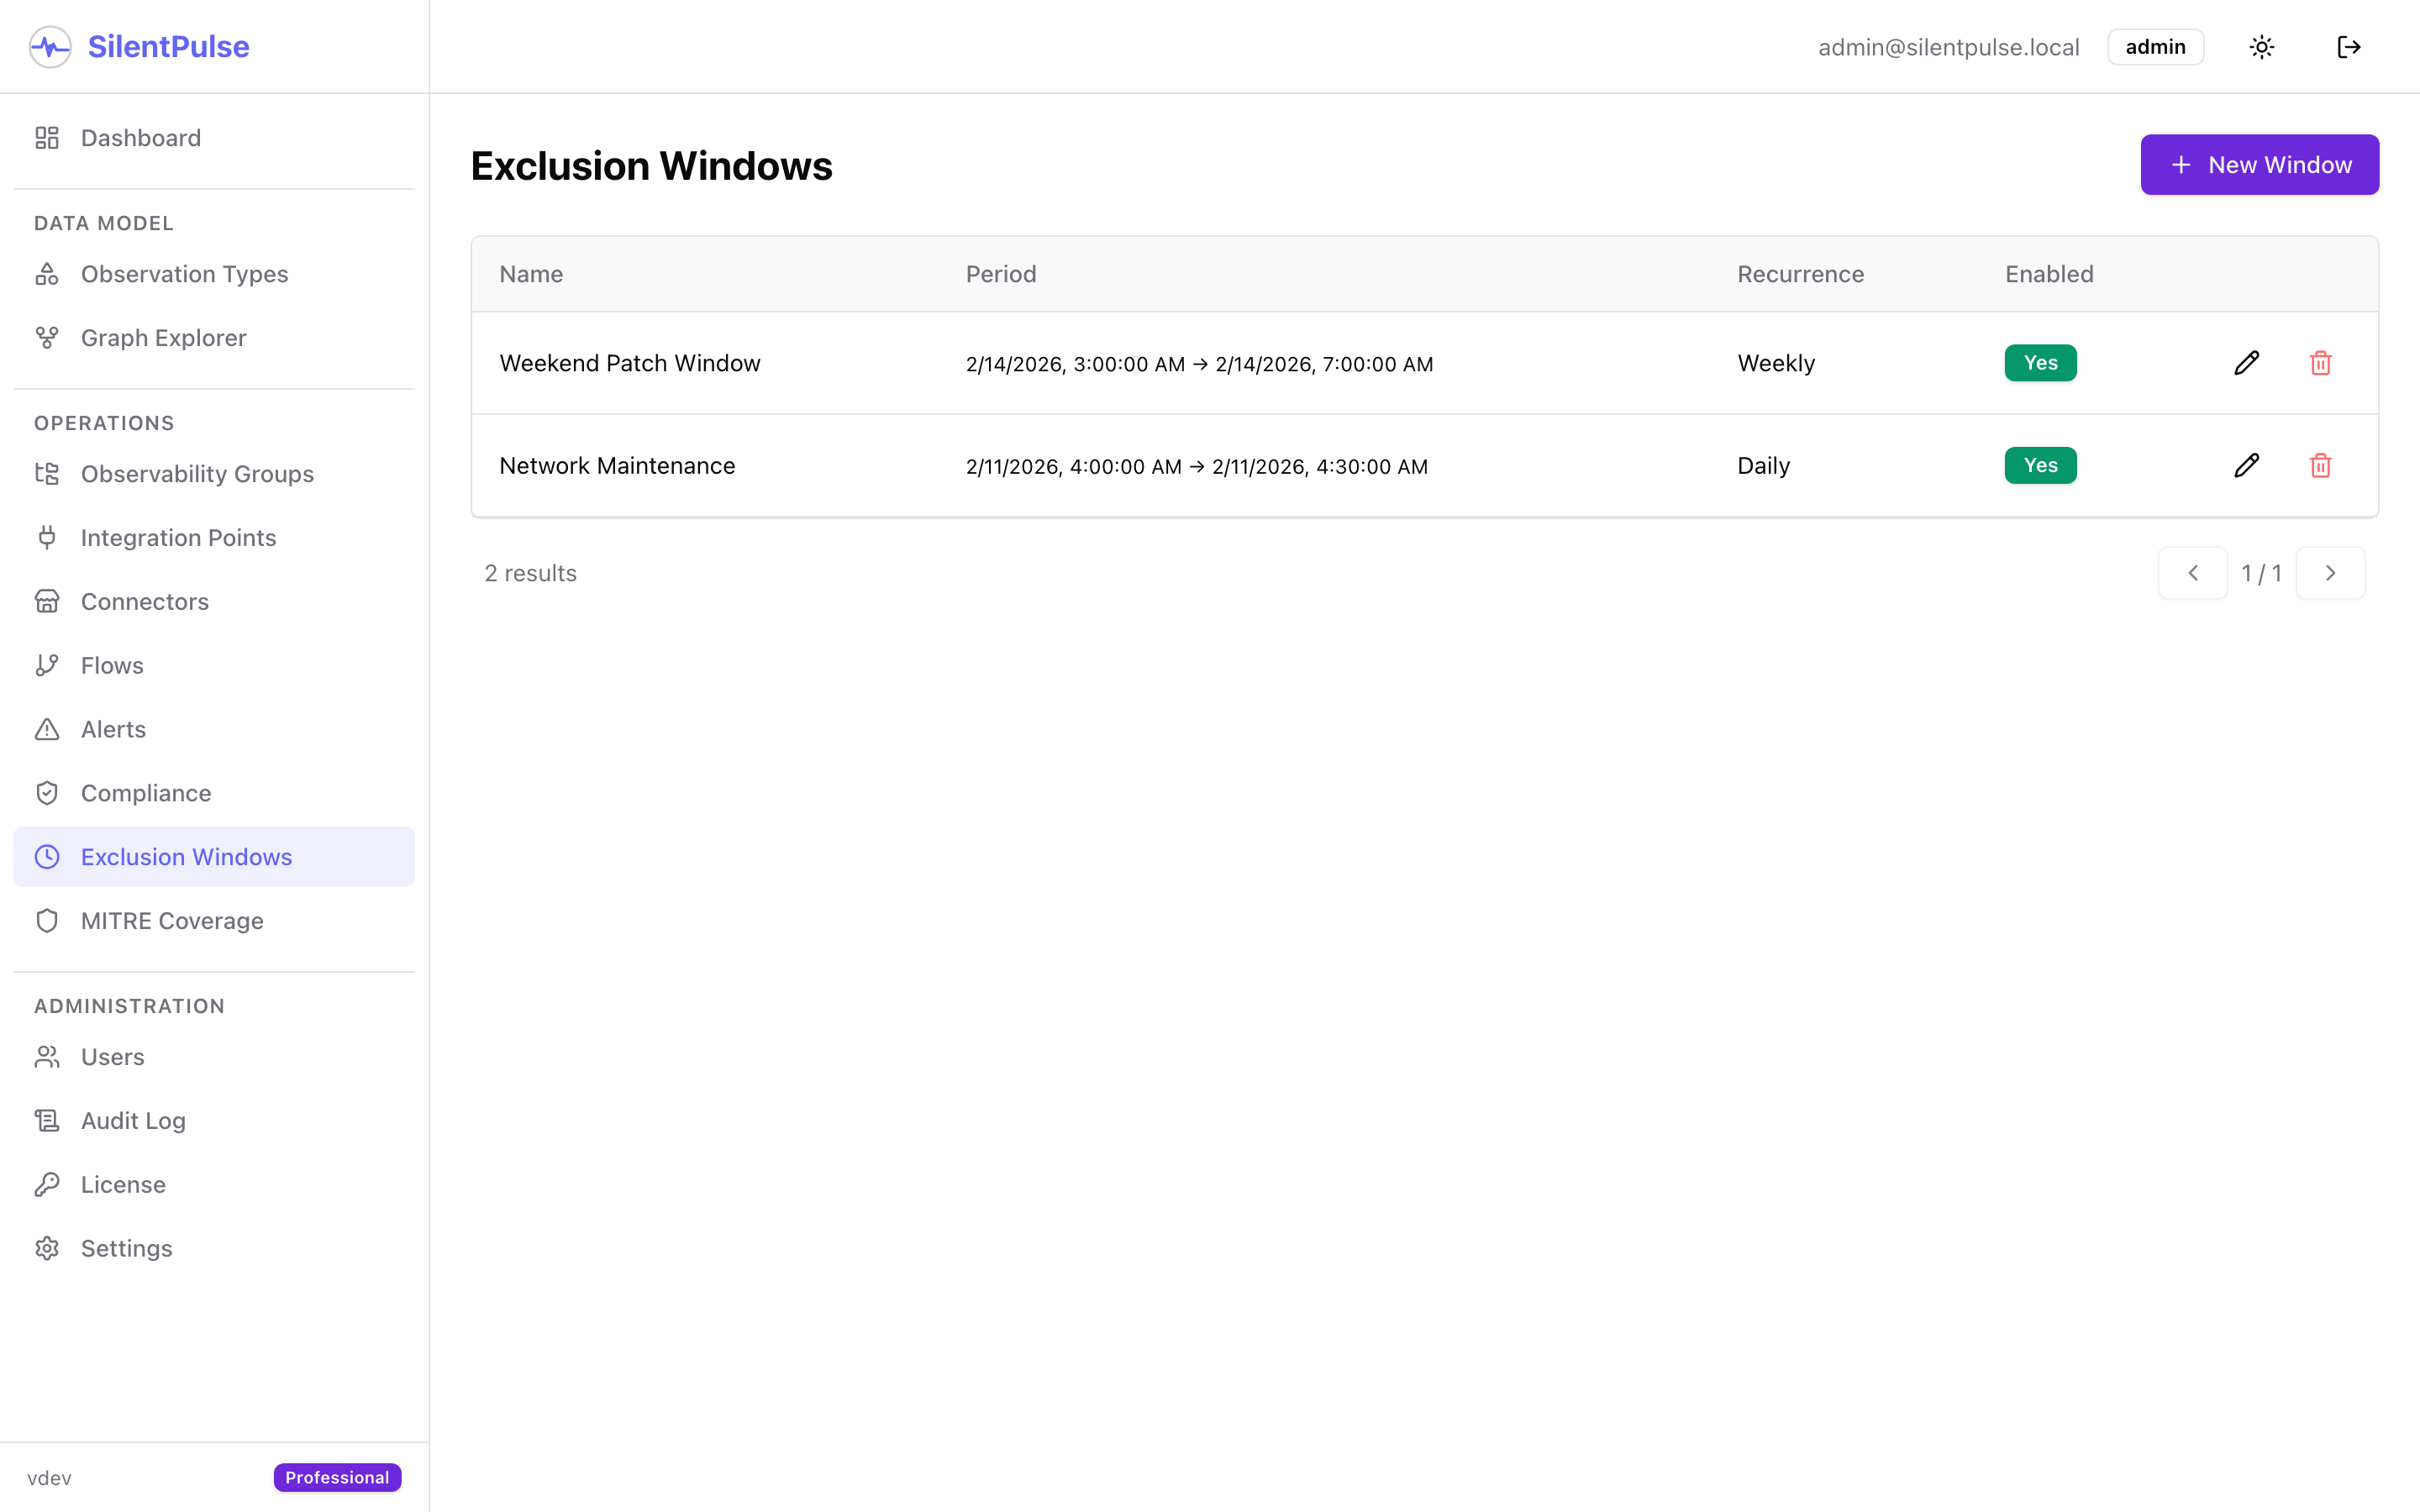
Exclusion windows. Your database backup runs every night at 3 AM and the backup process stops the audit log agent for 30 minutes? Define an exclusion window. SilentPulse won’t alert during known maintenance, but will alert the second the window expires if telemetry hasn’t resumed.
Flexible alerting. Route critical server alerts to Slack instantly. Batch database notifications into 5-minute digests. Send everything to a webhook for your custom automation. Different rules for different groups, with configurable grouping and deduplication.
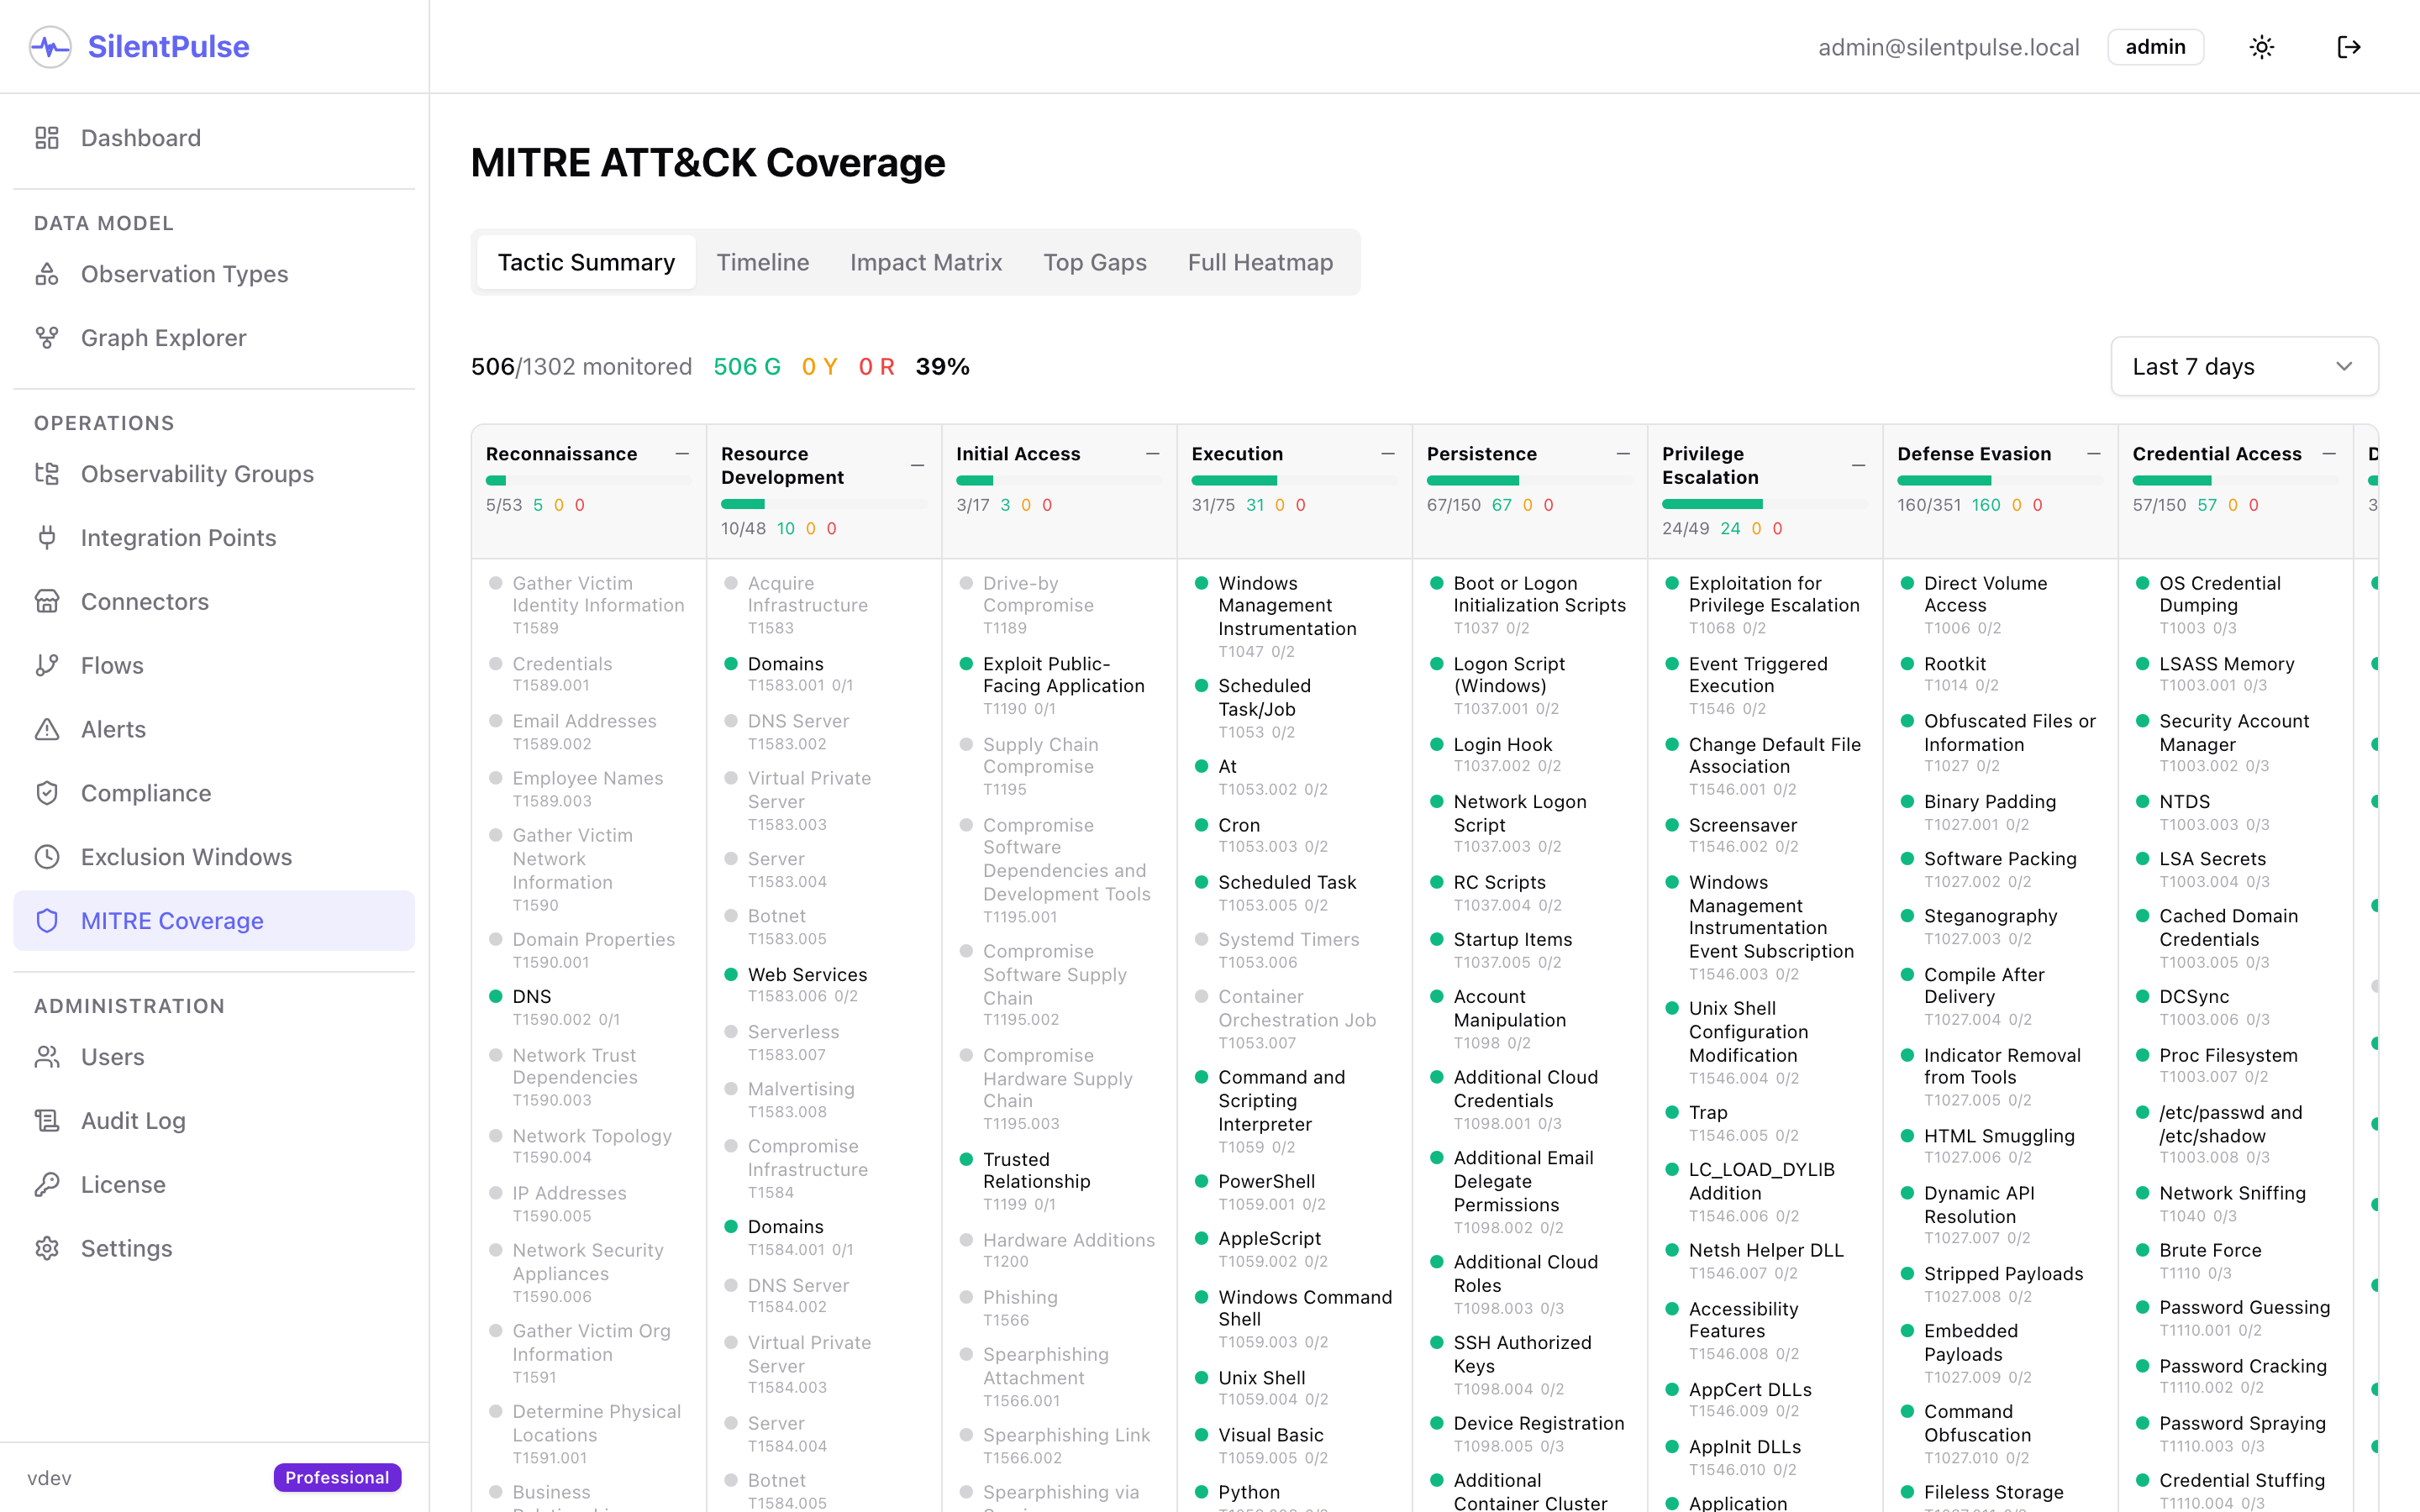
MITRE ATT&CK mapping. When a security function degrades, SilentPulse shows you exactly which MITRE techniques lose detection coverage. Not abstract risk scores, but concrete, actionable impact: “Technique T1078 (Valid Accounts) is no longer monitored in this segment because authentication telemetry stopped flowing.”
The principles we won’t compromise on
We’re building SilentPulse with a set of non-negotiable principles. These aren’t marketing bullet points. They’re engineering decisions baked into every line of code.
Open source
The core of SilentPulse is and will remain open source. You can read every line of code. You can audit it. You can fork it. You can run it in an air-gapped network with no internet access and no license server phoning home.
Security tools that monitor your security infrastructure should be transparent. Full stop. You shouldn’t have to trust a black box to tell you whether your other black boxes are working.
Your infrastructure, your rules
SilentPulse runs wherever you need it. On-premises in your own Kubernetes cluster. In your AWS account. In Azure. In GCP. On a single VM in a lab. The deployment model is yours to choose, and switching between them doesn’t require rearchitecting anything.
There is no SaaS-only tier. There is no “cloud edition with more features.” Every capability is available in every deployment model. We believe that where you run your security monitoring is a decision for your security team, not your vendor’s sales team.
No ceiling on scale
Whether you’re monitoring 50 assets across 2 data sources or 500,000 assets across 40 data sources in 12 regions, SilentPulse scales horizontally without architectural changes. The same connector that monitors a 10-node Kafka cluster works for a 500-node cluster. The same flow definition that tracks 15 servers tracks 15,000.
We’ve seen too many tools that work beautifully for the first 100 assets and then need an “enterprise architecture review” at 1,000. That’s not how we build software.
Zero vendor lock-in
Your data stays yours. Your configuration is portable. Every integration uses open standards and documented APIs. If you decide tomorrow that SilentPulse isn’t for you, you can export everything and walk away. We’d rather earn your continued use than trap you into it.
What’s next
We’re heads-down building. There’s a lot more coming: features we’re not ready to announce yet, integrations we’re finishing, and capabilities that will fundamentally change how organizations think about security telemetry.
If the problem we described in our first post resonated with you, if you’ve ever stared at a SIEM timeline during an incident and wondered how long you were blind, then we’re building this for you.
Follow us here and on LinkedIn for updates. The silence is about to get a lot louder.
Want to see SilentPulse in action?
We'd love to walk you through a live demo tailored to your environment, your stack, your scale, your blind spots. No slides, no fluff. Just the product.
Request a Demo