Last week Databricks announced Lakewatch, their new open, agentic SIEM built on the Data Intelligence Platform. It’s a serious product: unified security telemetry on the lakehouse, Detection-as-Code, AI-powered triage with Claude, Unity Catalog governance. For security teams drowning in vendor lock-in and per-GB licensing, it’s a compelling alternative.
We’re genuinely excited about it. And we want to explain why it makes SilentPulse more relevant, not less.
The problem Lakewatch solves
Traditional SIEMs are expensive data warehouses with a detection engine bolted on. You pay per byte ingested. You’re locked into a proprietary query language. Retention is limited because storage is tied to compute costs. When you need to hunt across six months of DNS data, you either pay a fortune or accept that you can’t.
Lakewatch flips this. Your security telemetry lives in Delta tables on S3 or ADLS. You query it with SQL. You retain it for years at object storage prices. AI agents triage alerts so analysts can focus on real threats instead of chasing false positives.
This is a meaningful improvement. But it has a fundamental assumption baked in: the data is actually flowing.
The problem Lakewatch doesn’t solve
Here is a scenario. Your company runs CrowdStrike on 5,000 endpoints. Those events flow through a Spark Declarative Pipeline in Databricks, get normalized to OCSF, and land in Lakewatch for detection and response.
On a Tuesday afternoon, a Windows update on Floor 3 kills the CrowdStrike sensor on 47 machines. The endpoints are still online. Active Directory still sees them. They still appear in your CMDB as “monitored.”
But they stopped sending telemetry.
Lakewatch won’t notice. It can’t. A SIEM processes what arrives. It has no concept of what should arrive. If 47 endpoints stop sending EDR events, Lakewatch just has fewer events to analyze. No alert fires. No dashboard turns red. The absence of data is invisible.
Now the attacker compromises one of those 47 machines. Lateral movement, credential theft, data exfiltration. All happening on a host with no security telemetry.
Your SIEM is working perfectly. Your detection rules are passing all tests. Your AI agents are triaging every alert. And you’re completely blind.
A simple analogy
Think of it like a building with 200 security cameras.
Lakewatch is the monitoring room where analysts watch the feeds, review recordings, and use AI to spot suspicious behavior.
SilentPulse is the system that checks whether all 200 cameras are actually recording. If camera 147 goes dark, SilentPulse alerts the team before anyone breaks into that hallway.
The monitoring room (Lakewatch) is useless for hallway 147 if it never gets that feed. The camera-health system (SilentPulse) is useless if nobody watches the feeds it helps protect.
They’re not competing. They’re two layers of the same defense.
What SilentPulse does
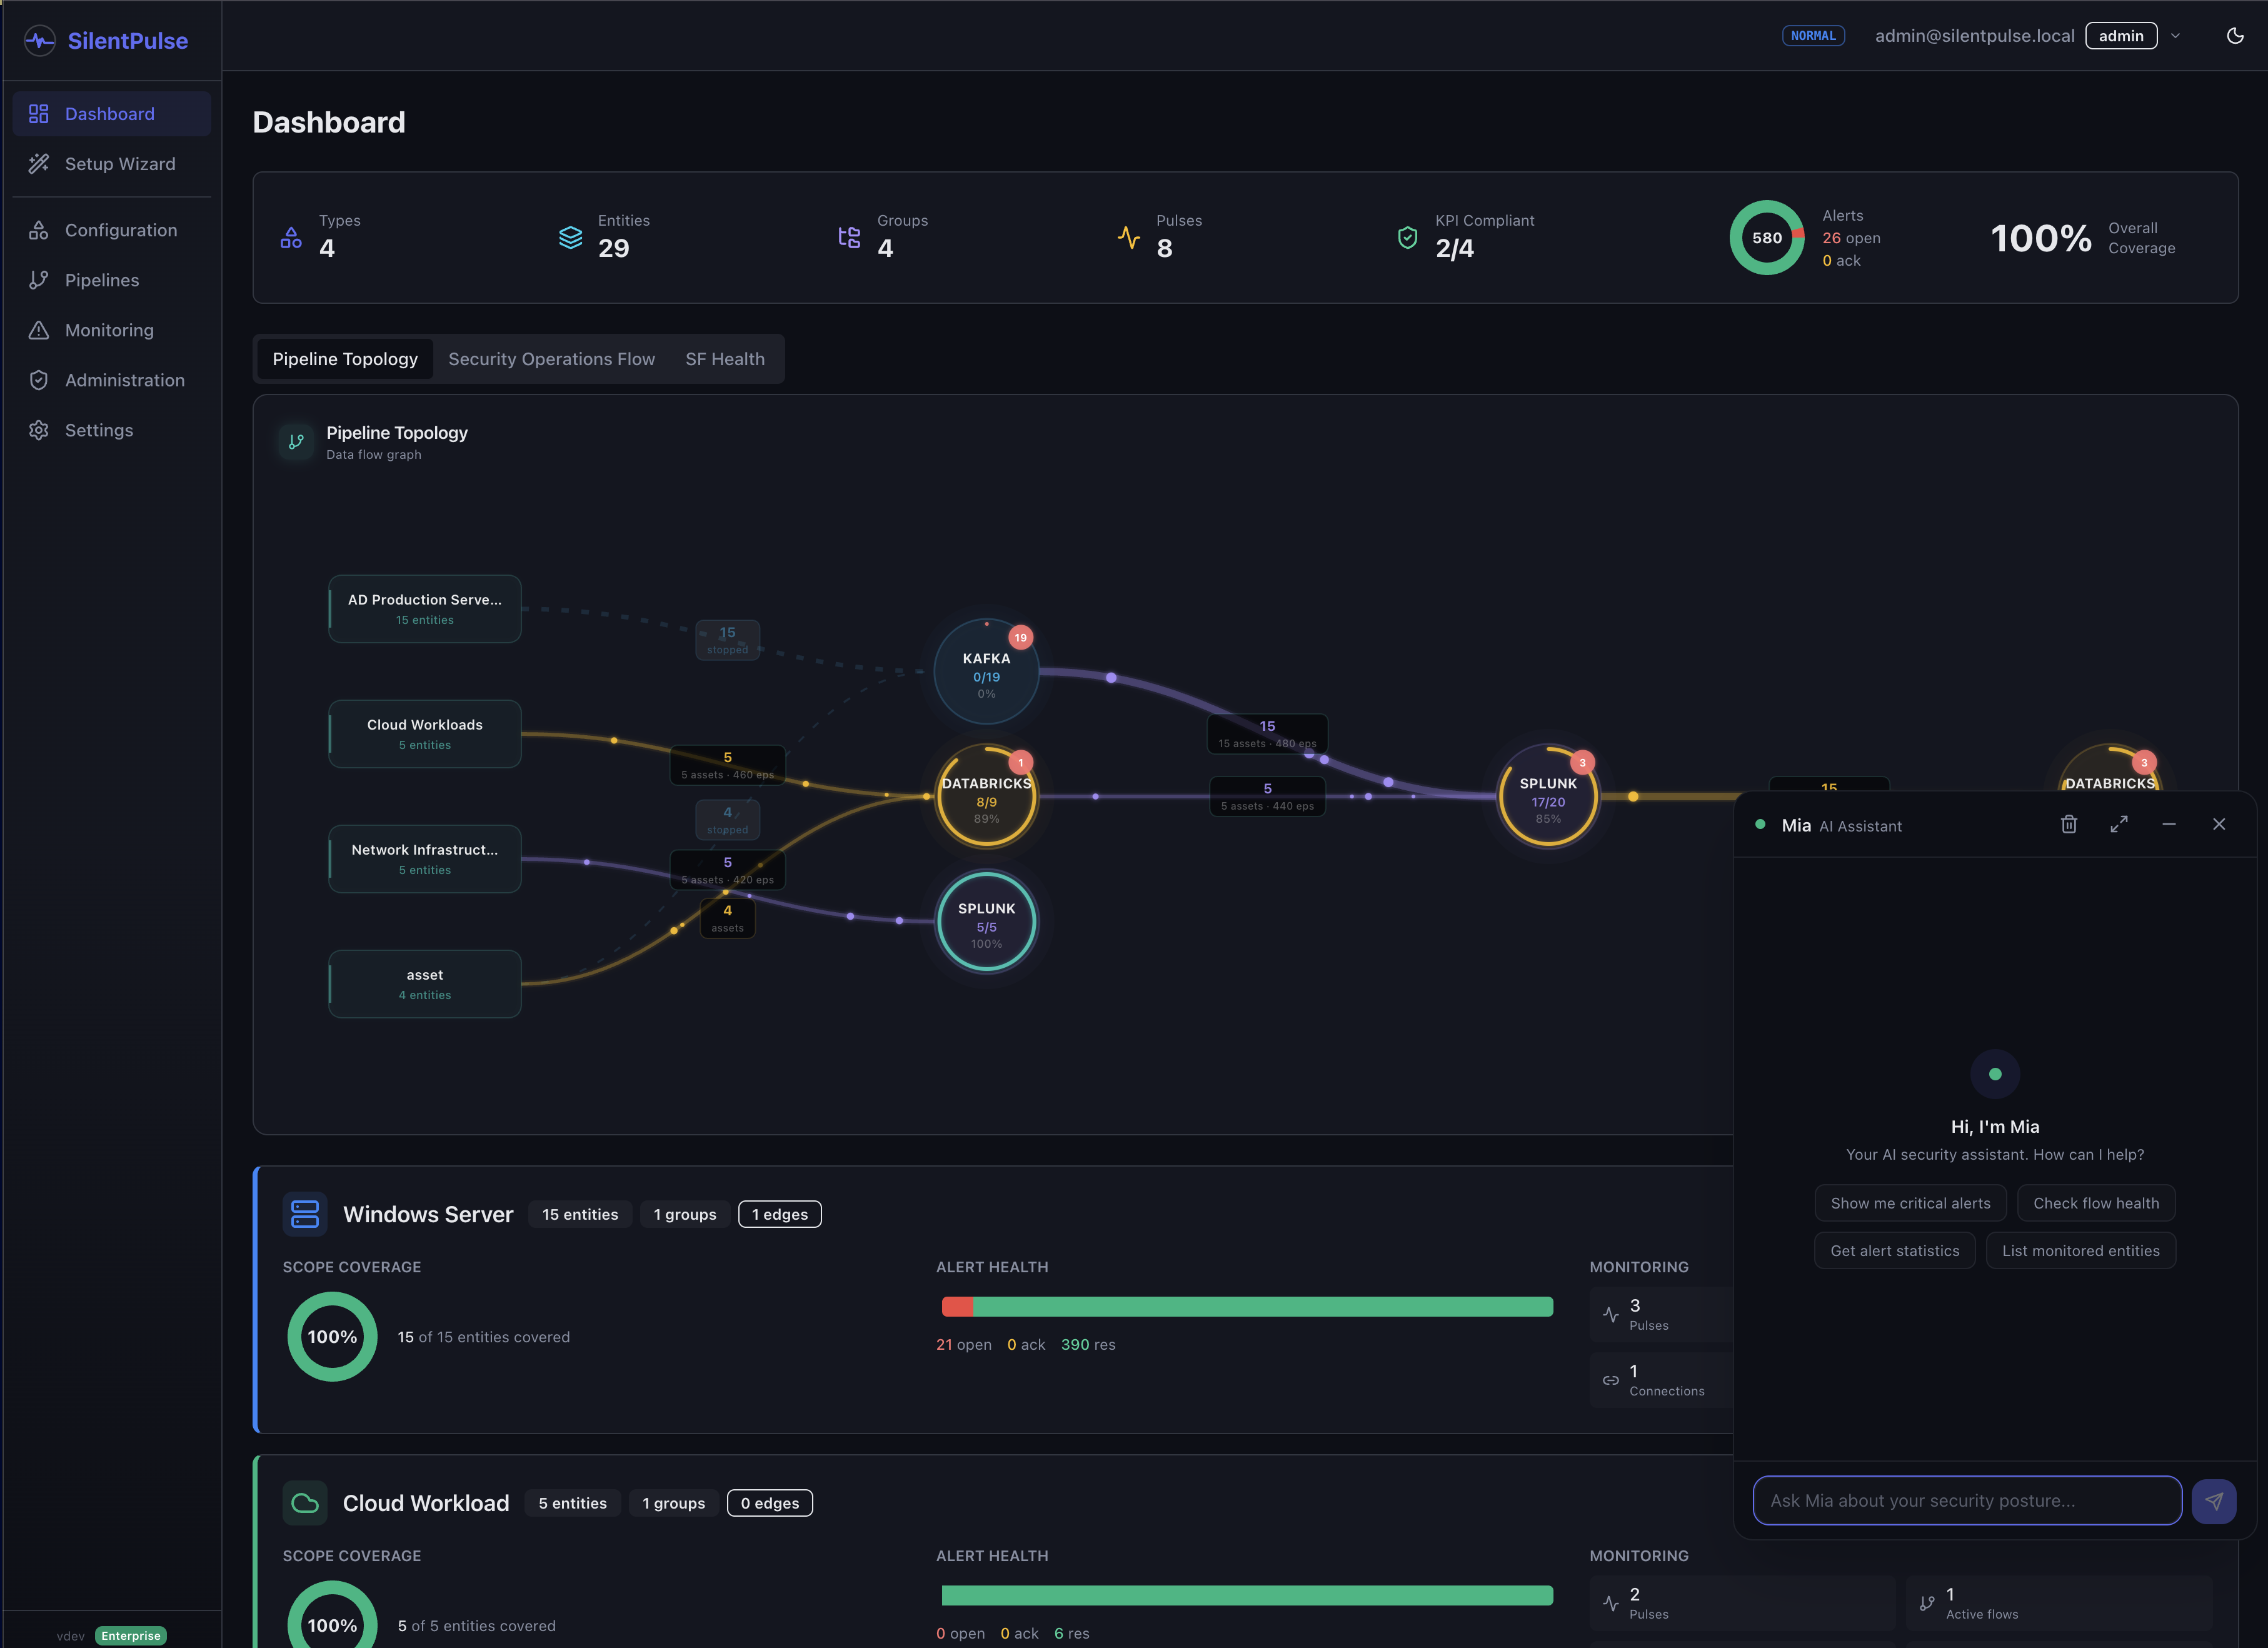
SilentPulse monitors the pipeline, not the content. It tracks:
- Silence: which assets stopped producing telemetry, and when
- Degradation: which data feeds are thinning out, losing events, or arriving late
- Coverage gaps: which assets should be reporting to which data sources, and aren’t
- Impact: what detection capabilities you’ve lost because of each gap (mapped to MITRE ATT&CK)
Every asset. Every data source. Every hop in the pipeline, from source to collection, transport to processing, processing to analytics. SilentPulse tracks each asset at each stage independently. If host-4421 is visible in Kafka but missing in Splunk, that’s a transport gap. If it’s in Splunk but not in Databricks, that’s an analytics gap. Different root causes, different remediation.
Built-in connectors cover the most common security data infrastructure: Kafka, Splunk, Elasticsearch, Syslog, SQL databases, HTTP/REST APIs, and webhook receivers. The connector marketplace adds community integrations for tools like ServiceNow, Palo Alto, and CrowdStrike. Each connector runs as a worker that polls the target system, checks which assets reported in the last time window, and writes results to the cache. The scheduler compares observed assets against expected (from your CMDB) and creates alerts for anything missing.
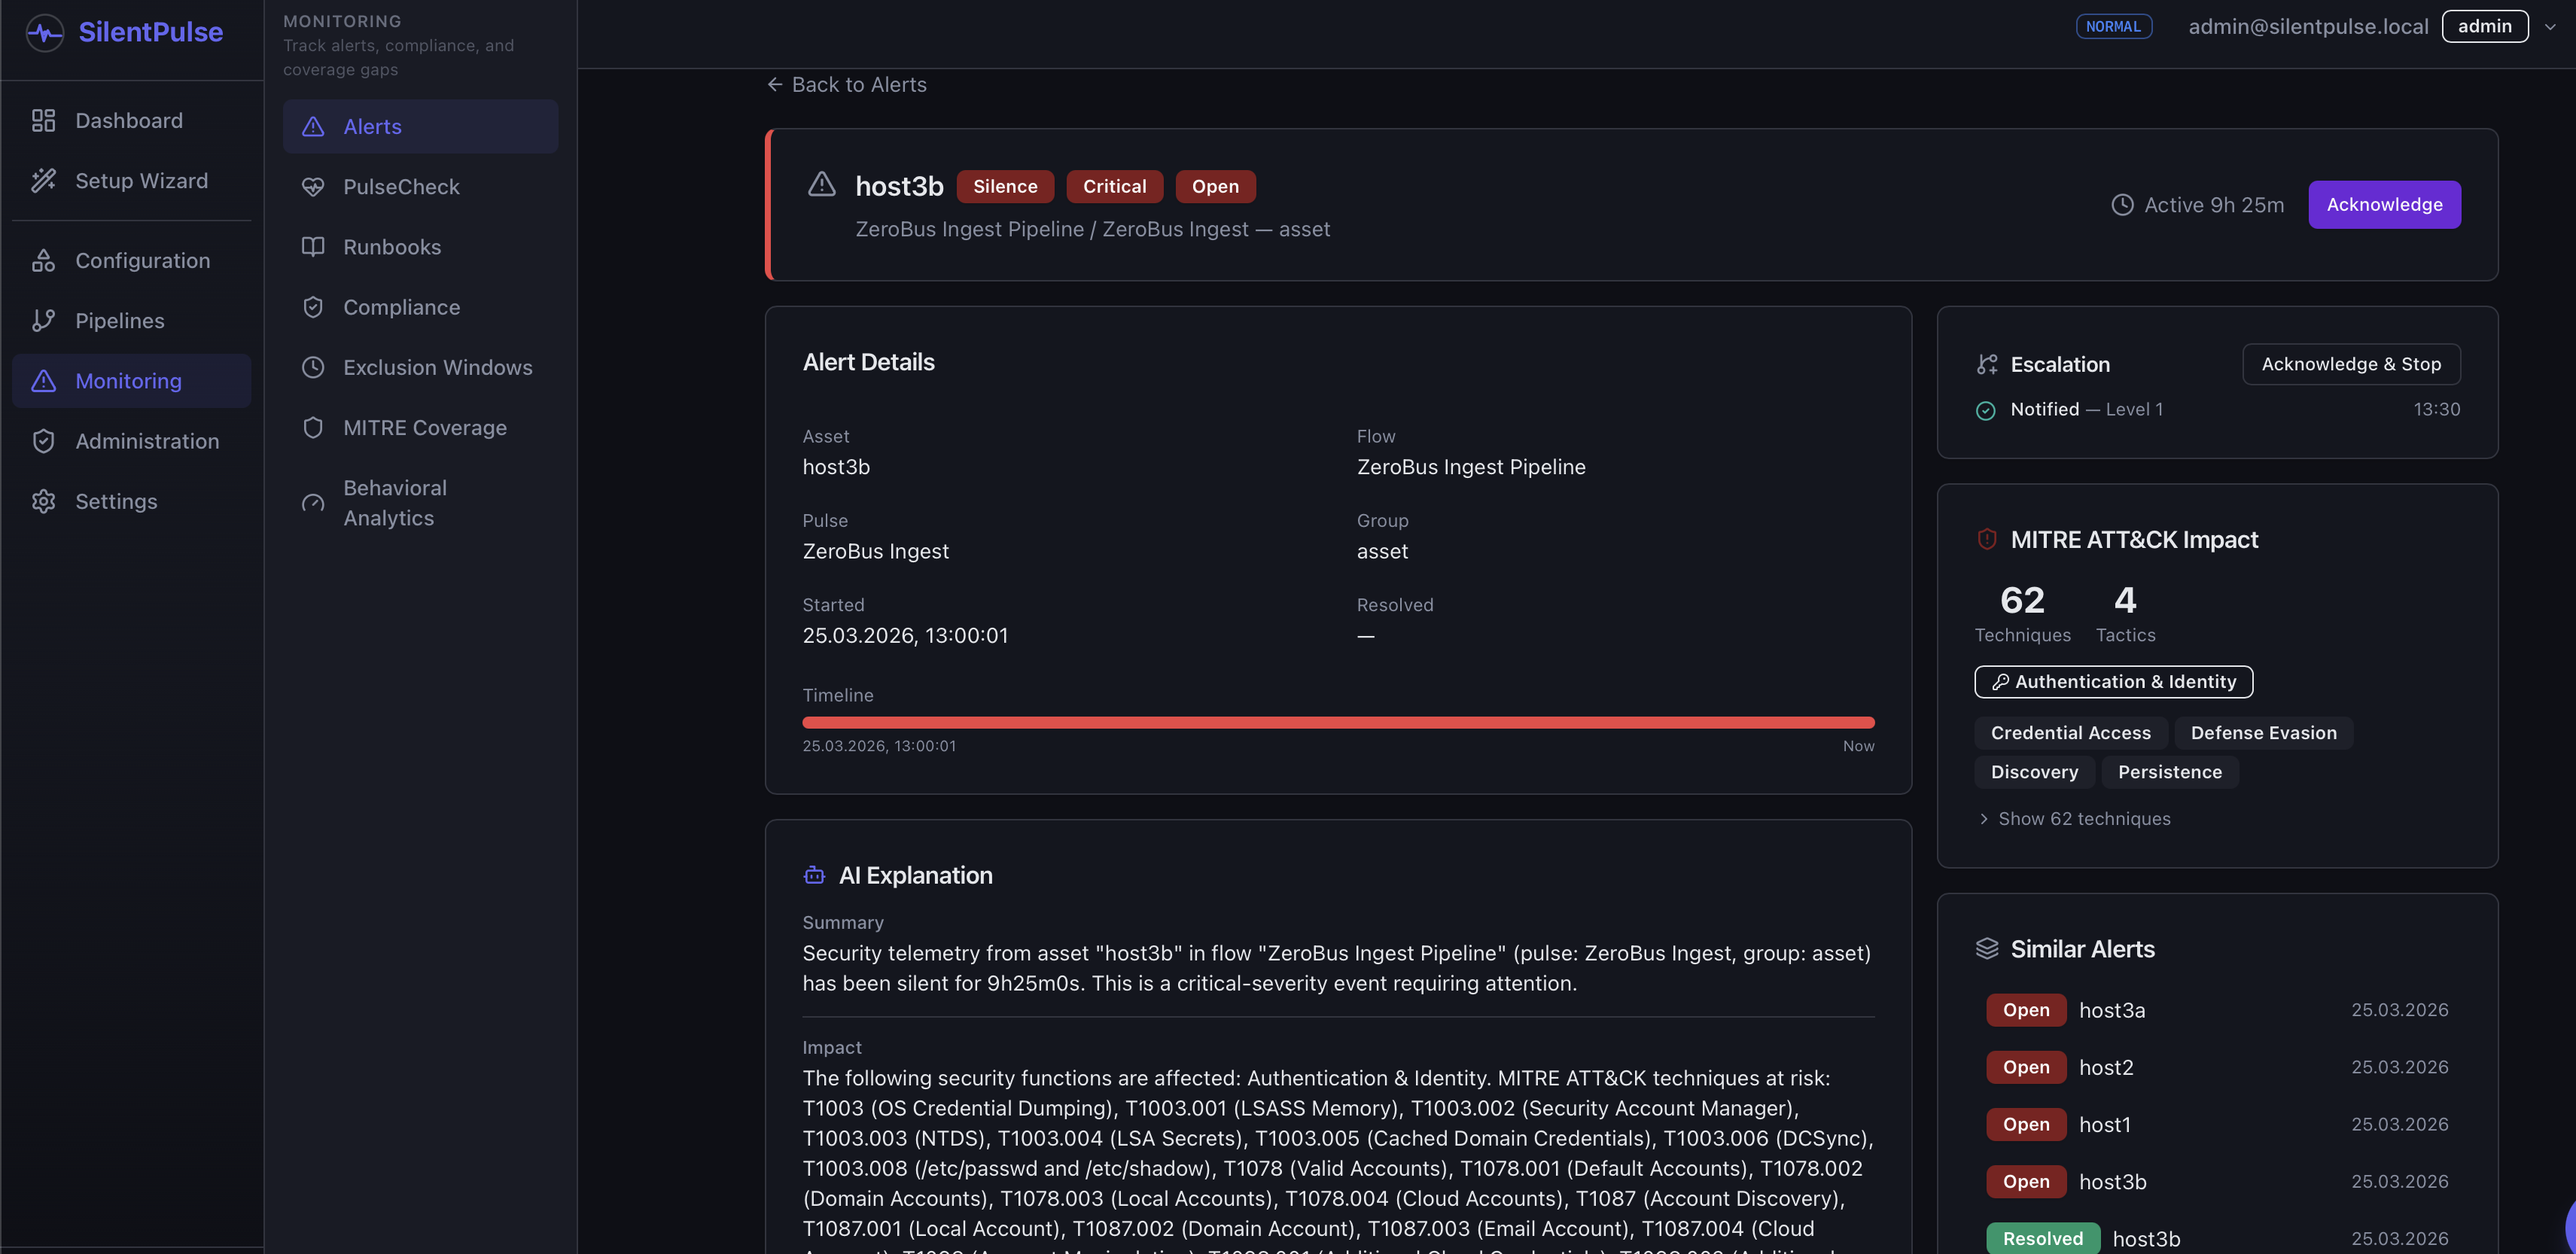
When something goes wrong, SilentPulse doesn’t just say “pipeline unhealthy.” It tells you: 47 endpoints in Building B stopped reporting CrowdStrike telemetry 3 hours ago. This eliminates coverage for T1059 (Command and Scripting Interpreter), T1547 (Boot or Logon Autostart Execution), and 14 other techniques. Here’s the remediation playbook.
How it works with Databricks
We just released silentpulse-databricks, an open-source integration that brings SilentPulse observability directly into your Databricks pipelines.
Decorators for SDP pipelines
Add observability to any Spark Declarative Pipeline table with Python decorators:
import dlt
from silentpulse_sdp import heartbeat, volume, completeness, freshness

@dlt.table(comment="Raw CrowdStrike events")
@heartbeat(integration_point="edr-crowdstrike", interval_seconds=300)
@volume(integration_point="edr-crowdstrike", min_rows=100)
def bronze_edr_events():
    return (
        spark.readStream
        .format("cloudFiles")
        .option("cloudFiles.format", "json")
        .load("/mnt/security/crowdstrike/")
    )
Four decorators, four types of monitoring:
| Decorator | What it watches | Example alert |
|---|---|---|
@heartbeat | Is this pipeline table still running? | ”No heartbeat from edr-crowdstrike for 15 minutes” |
@volume | Is data still flowing at expected rates? | “edr-crowdstrike volume dropped 94% in the last hour” |
@completeness | Are critical fields populated? | “source_ip is NULL in 23% of siem-normalized events” |
@freshness | Is the data current? | ”Newest event in edr-crowdstrike is 4 hours old” |
Streaming telemetry with foreachBatch
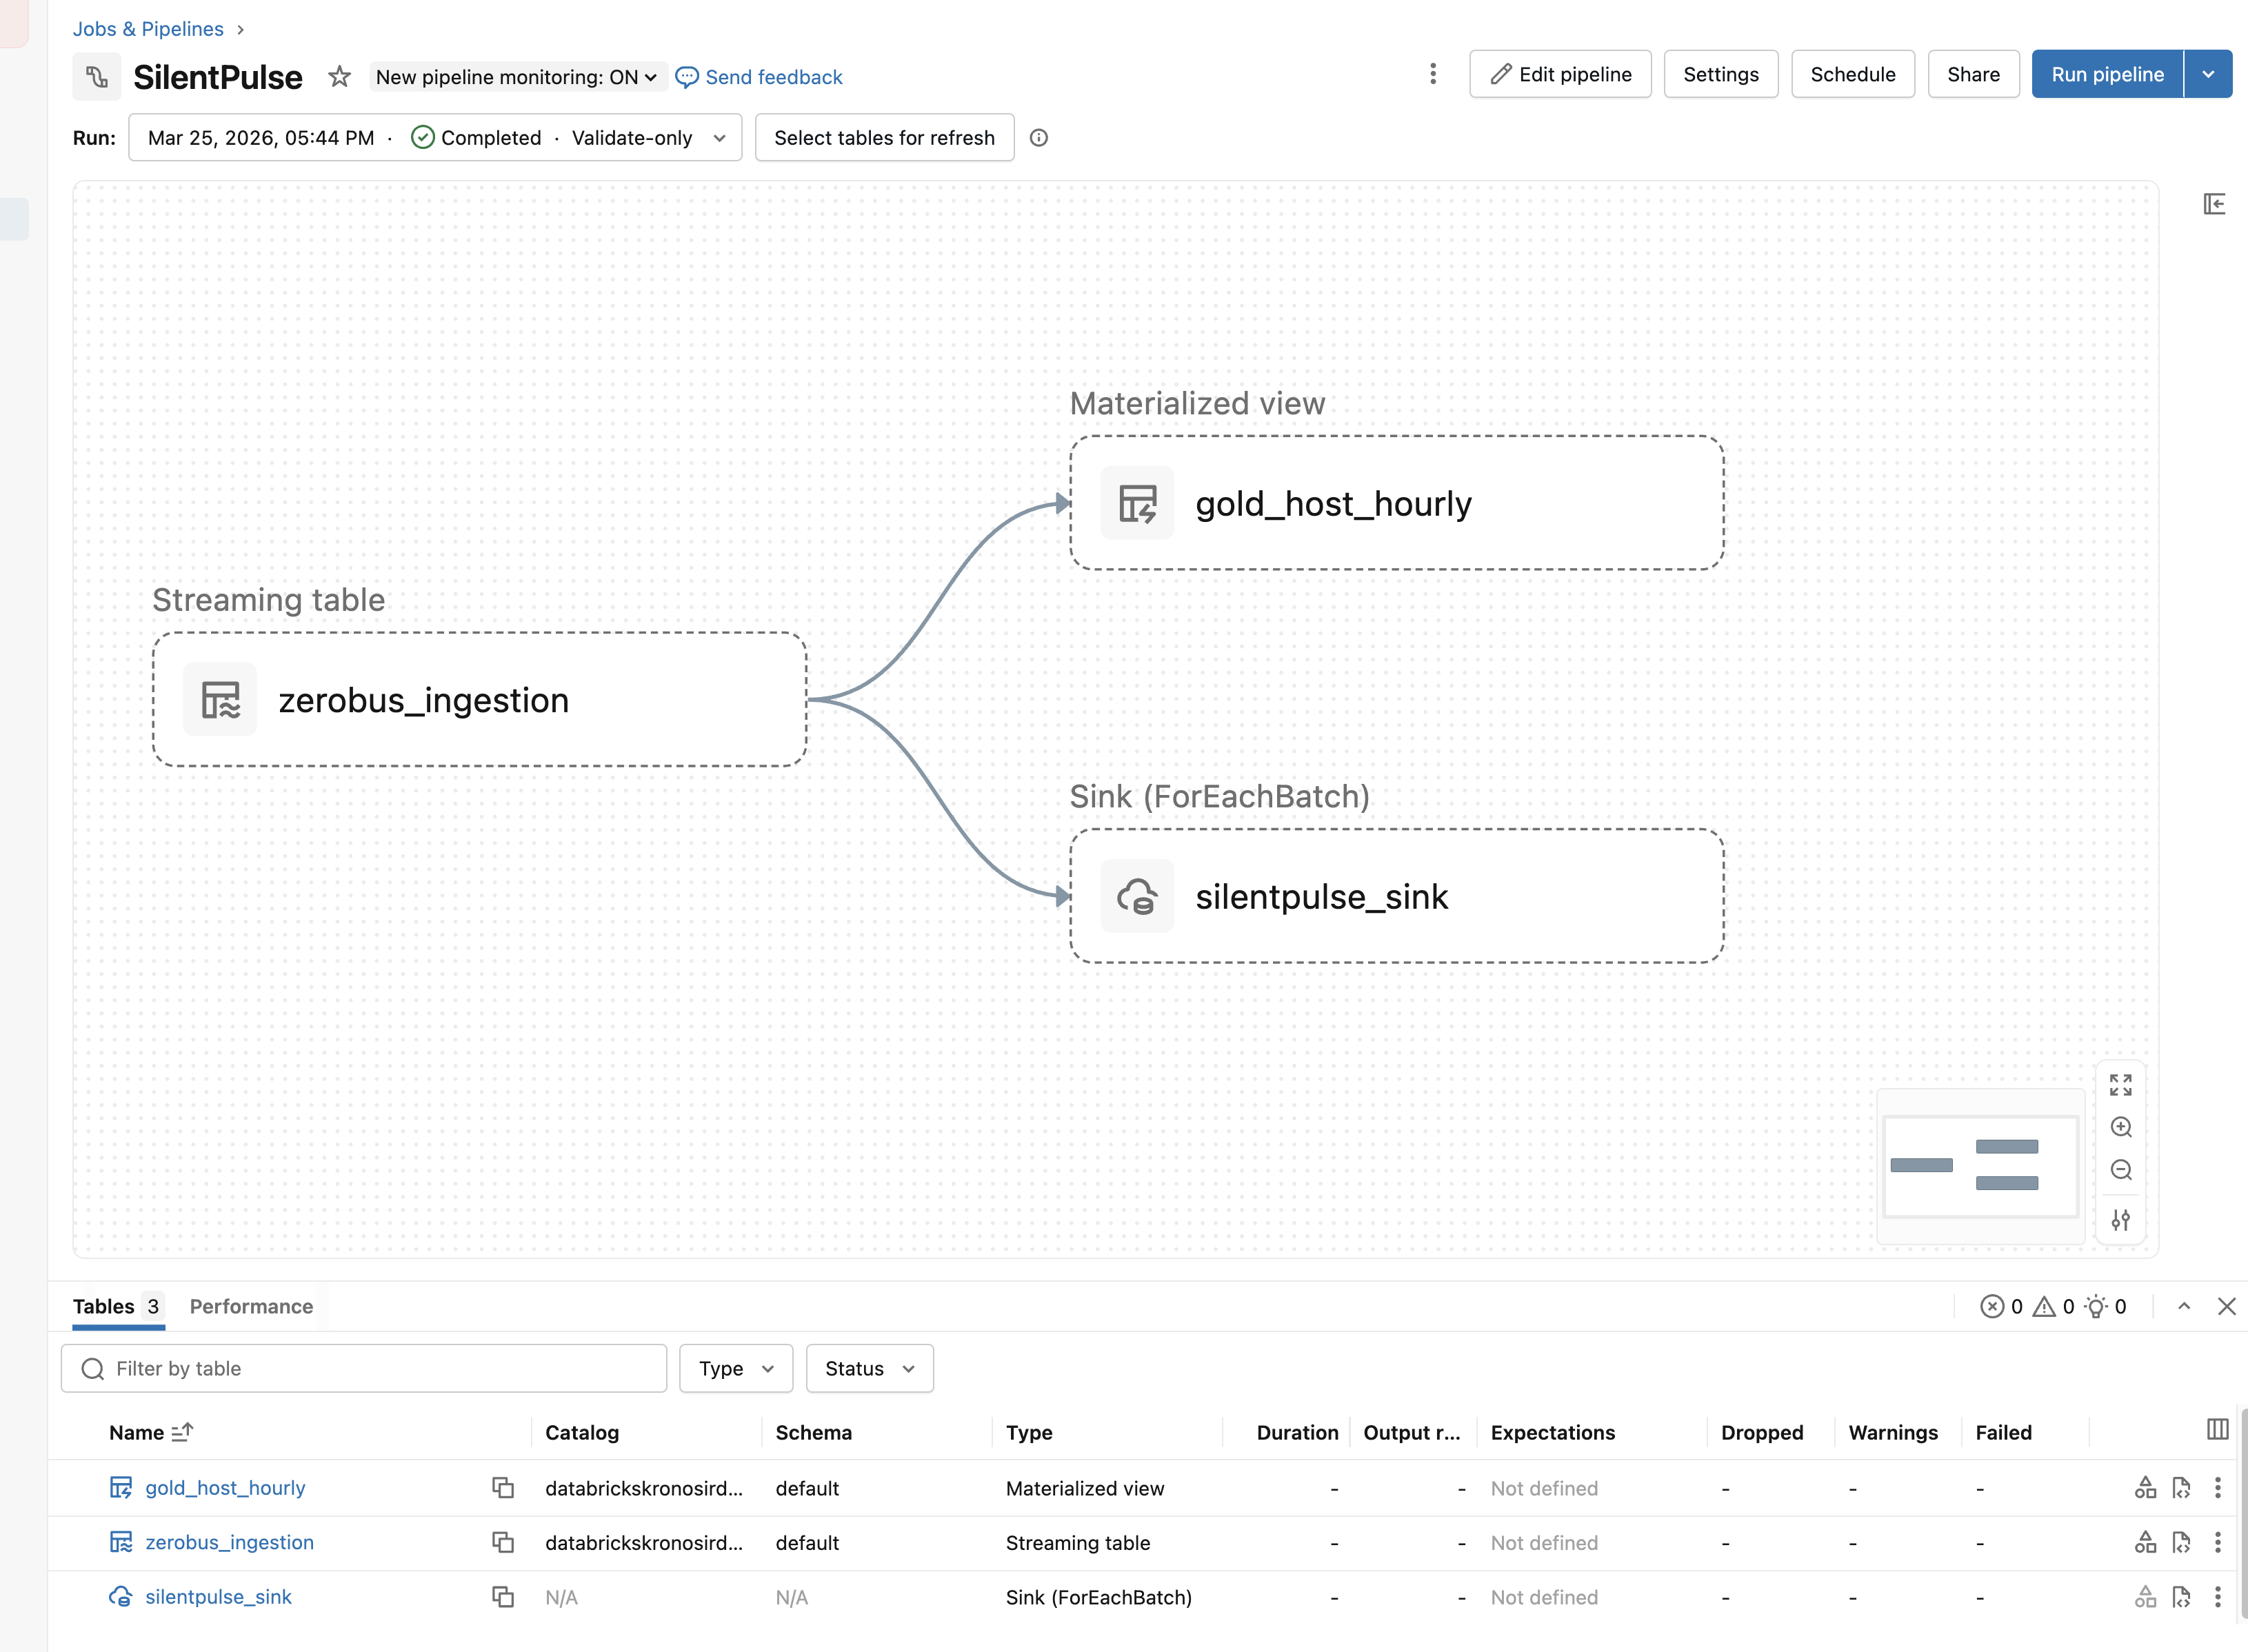
Decorators work well for batch tables. But streaming DataFrames can’t do collect() or groupBy(), so the decorators fall back to heartbeat-only. Since v0.1.7, you get full telemetry from streaming pipelines via foreachBatch:
from pyspark import pipelines as dp
from silentpulse_sdp import report_batch

@dp.foreach_batch_sink(name="silentpulse_sink")
def silentpulse_sink(batch_df, batch_id):
    from silentpulse_sdp import report_batch
    report_batch(
        batch_df, batch_id,
        integration_point="edr-crowdstrike",
        asset_column="host",
        min_rows=5,
        expected_columns=["host", "timestamp"],
        max_delay_seconds=600,
    )

@dp.append_flow(target="silentpulse_sink")
def telemetry_flow():
    return spark.readStream.table("bronze_edr_events")
Each micro-batch is a regular DataFrame, so all aggregation works. Heartbeat, volume, completeness, freshness, per asset, every batch. If SilentPulse is unreachable, the pipeline continues. Telemetry reporting never blocks your data.
Two entry points, same logic:
streaming_sink()returns a ready-madeforeachBatchhandlerreport_batch()goes inside your own handler when you need to write data and report telemetry in the same batch
Unity Catalog Discovery
Automatically discover your Databricks assets and register them in SilentPulse:
from silentpulse_uc_discovery import UCDiscovery

discovery = UCDiscovery(
    silentpulse_url="https://silentpulse.example.com/api",
    silentpulse_token=dbutils.secrets.get("silentpulse", "api_token"),
)

pipelines = discovery.discover_pipelines(catalog="security")
discovery.sync_to_silentpulse(pipelines)
No more manually maintaining asset inventories. SilentPulse learns what you have from Unity Catalog and monitors all of it.
Read SilentPulse data back into Databricks
Use the PySpark DataSource to bring visibility data into your lakehouse for analysis:
visibility_df = (
    spark.read
    .format("silentpulse")
    .option("resource", "alerts")
    .load()
)

# Cross-reference: which Lakewatch detections happened on assets with degraded telemetry?
lakewatch_alerts.join(
    visibility_df.filter("alert_type = 'degradation'"),
    on="asset_id",
    how="inner"
).display()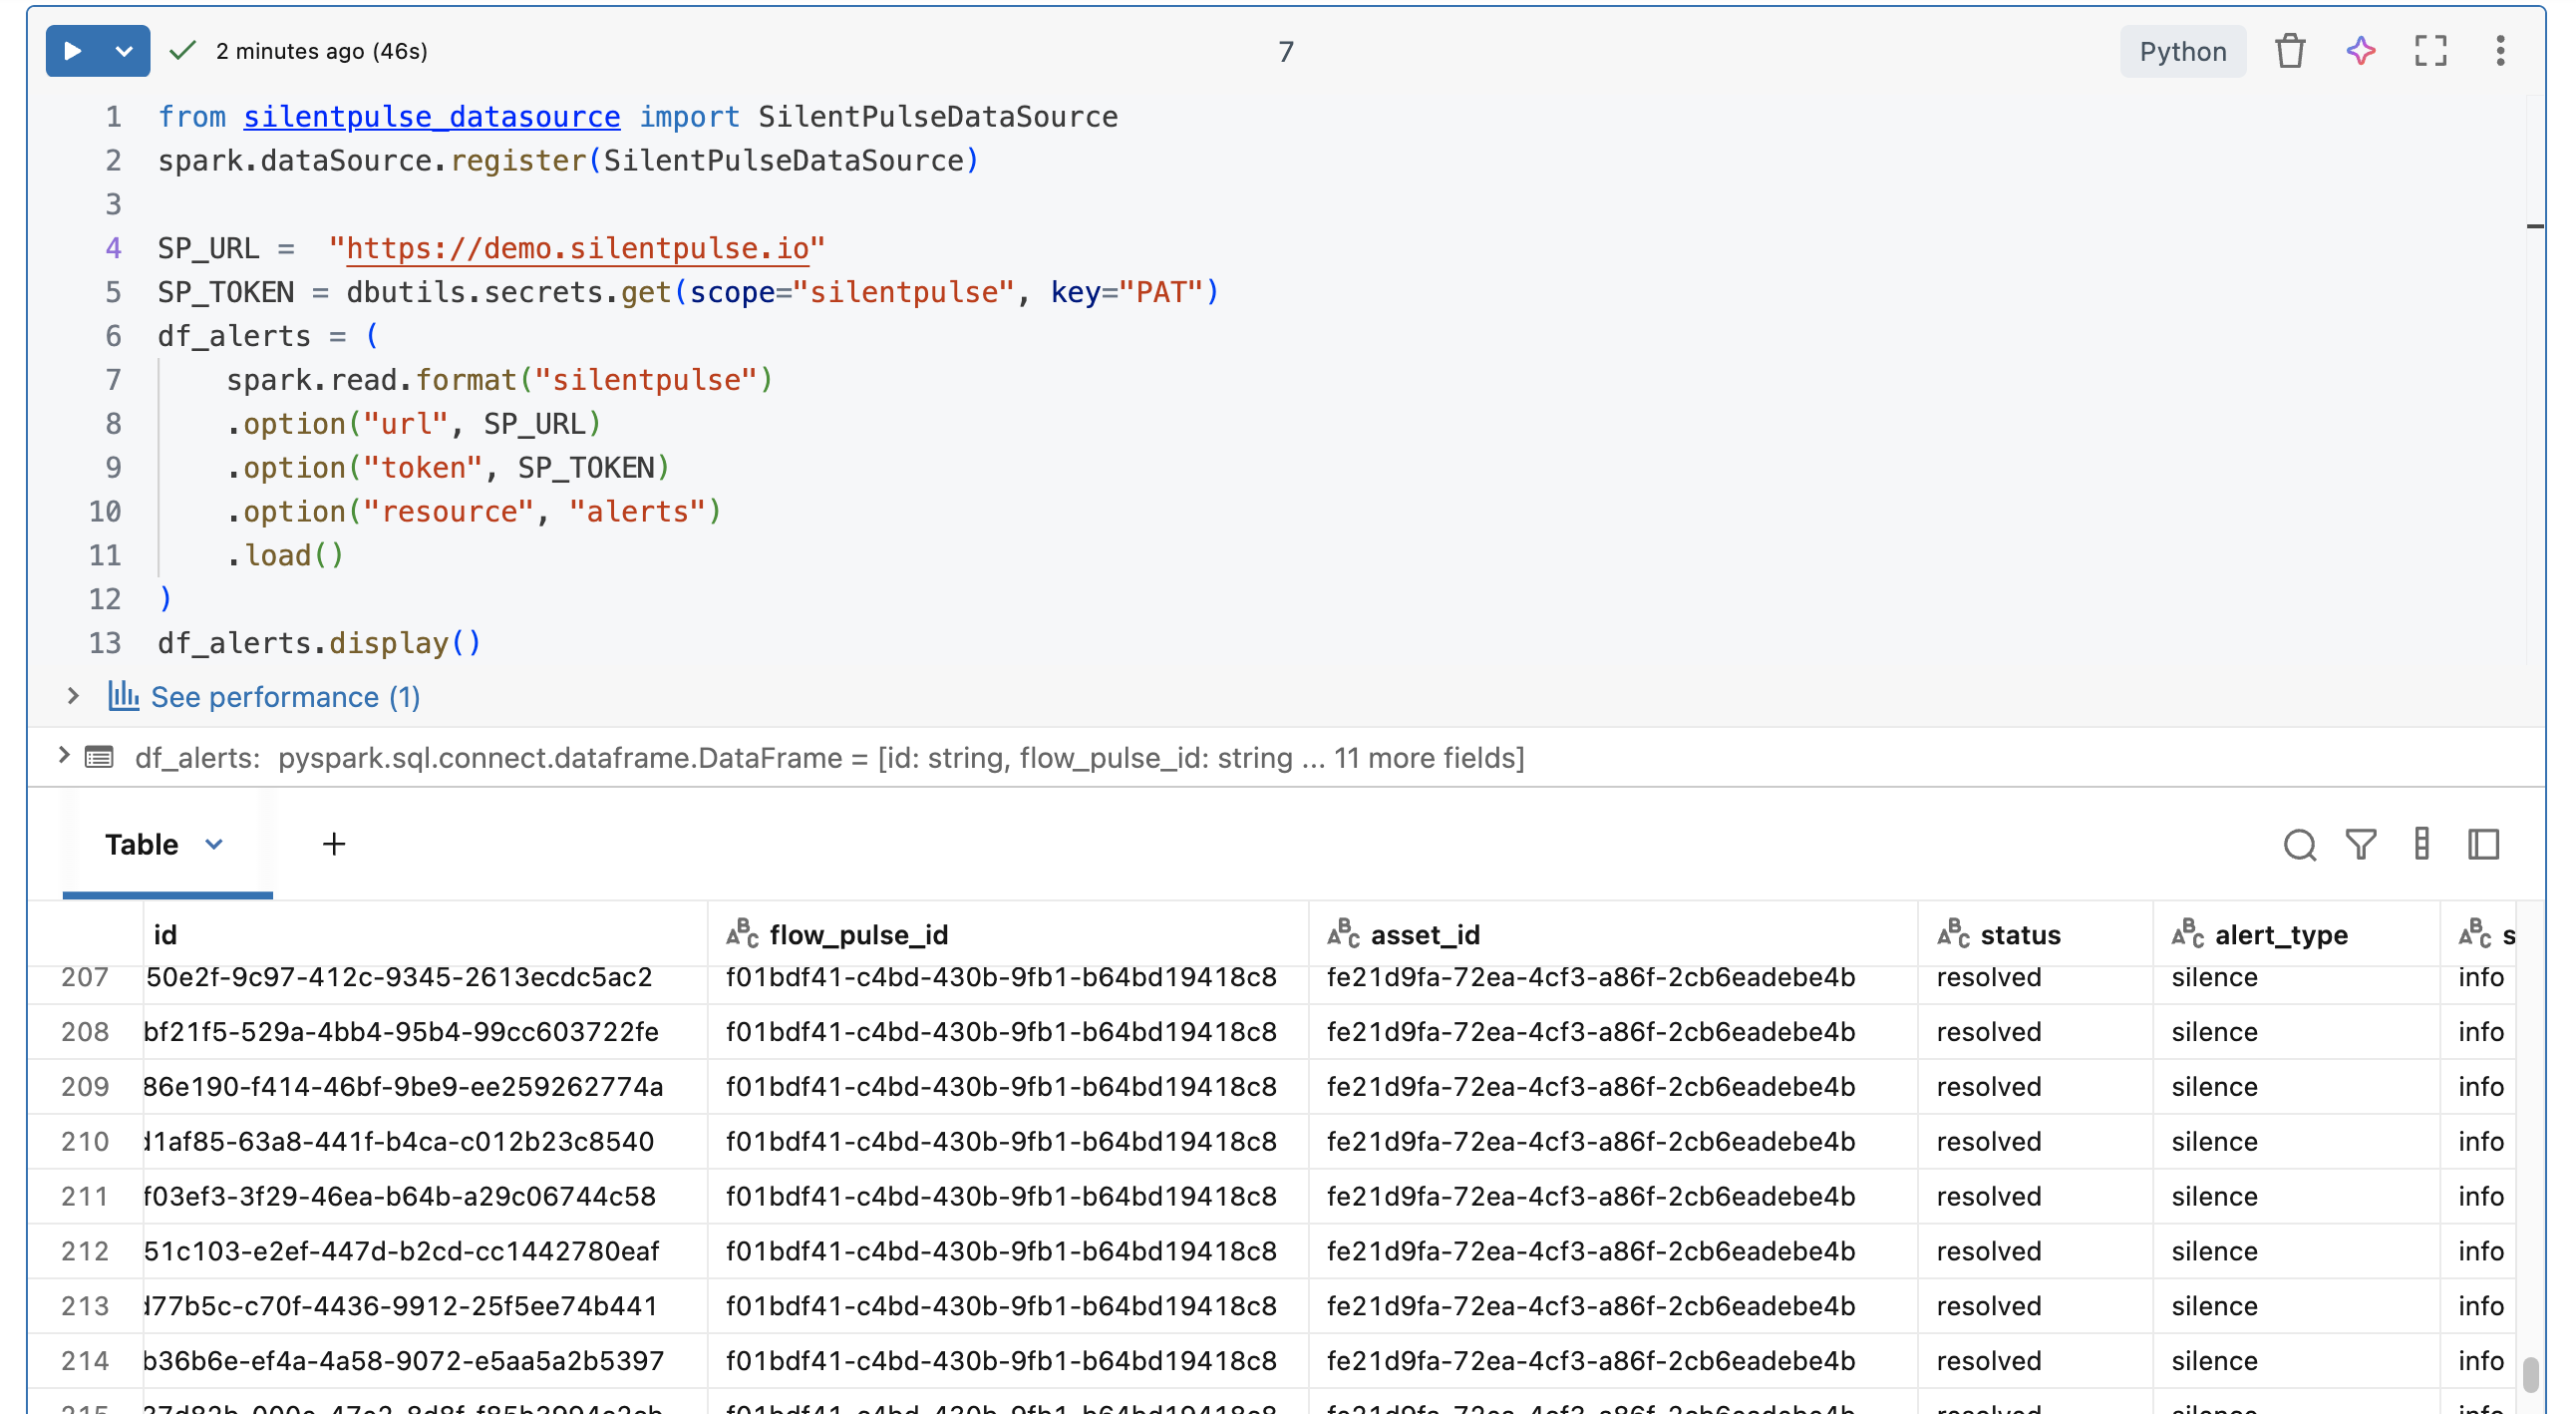
This is where it gets powerful: correlate Lakewatch threat detections with SilentPulse visibility data. Was the threat detected despite degraded telemetry? Or are there hosts where threats could be hiding because the data never reached Lakewatch in the first place?
The picture together
Your Infrastructure
    |
    v
Security Telemetry (EDR, firewall, DNS, cloud audit, ...)
    |
    +-----> SilentPulse (Is data flowing? From every asset? At expected rates?)
    |           ^
    |           | foreachBatch telemetry (per-asset heartbeat, volume, freshness)
    |           |
    v           |
Databricks SDP Pipeline (@heartbeat, @volume + streaming_sink/report_batch)
    |
    v
Lakewatch (OCSF normalization, Detection-as-Code, AI triage)
    |
    +--> Alert: "Suspicious PowerShell on HOST-4421"
    +--> But only if HOST-4421 is actually sending telemetry
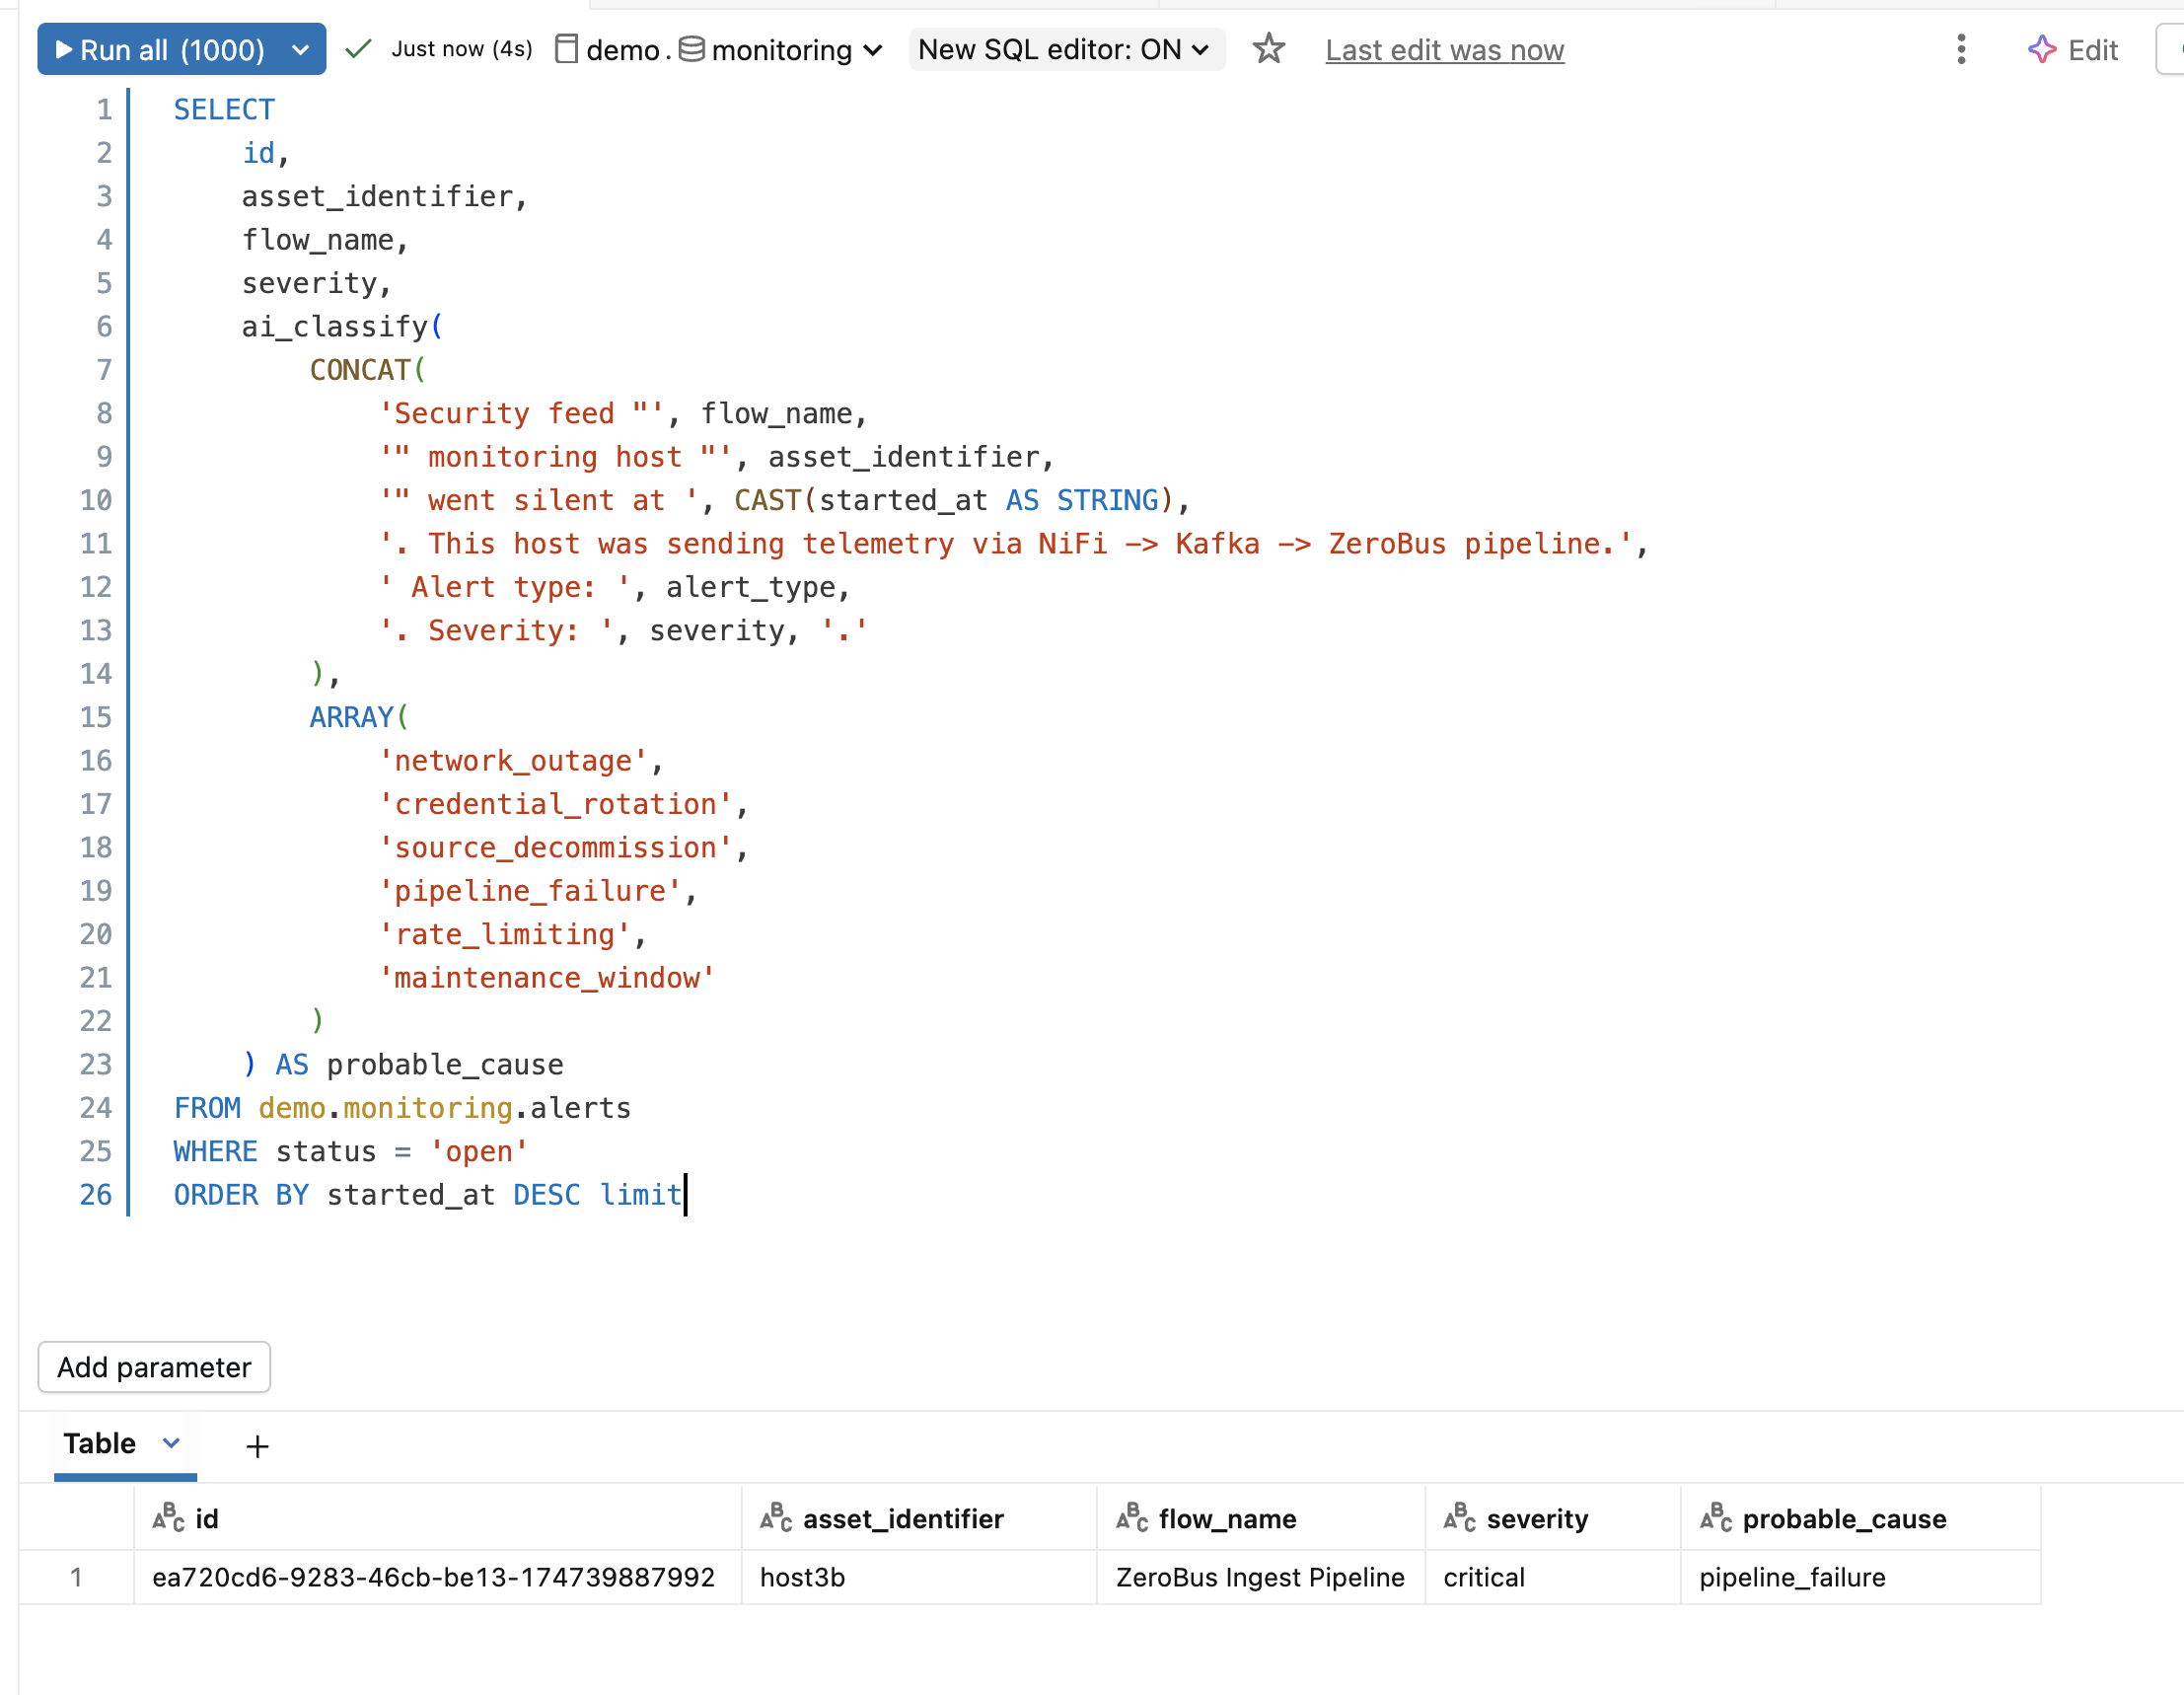
Combine it with Databricks AI Functions for automated root cause analysis. One ai_classify call on SilentPulse alerts returns probable causes without deploying a model:
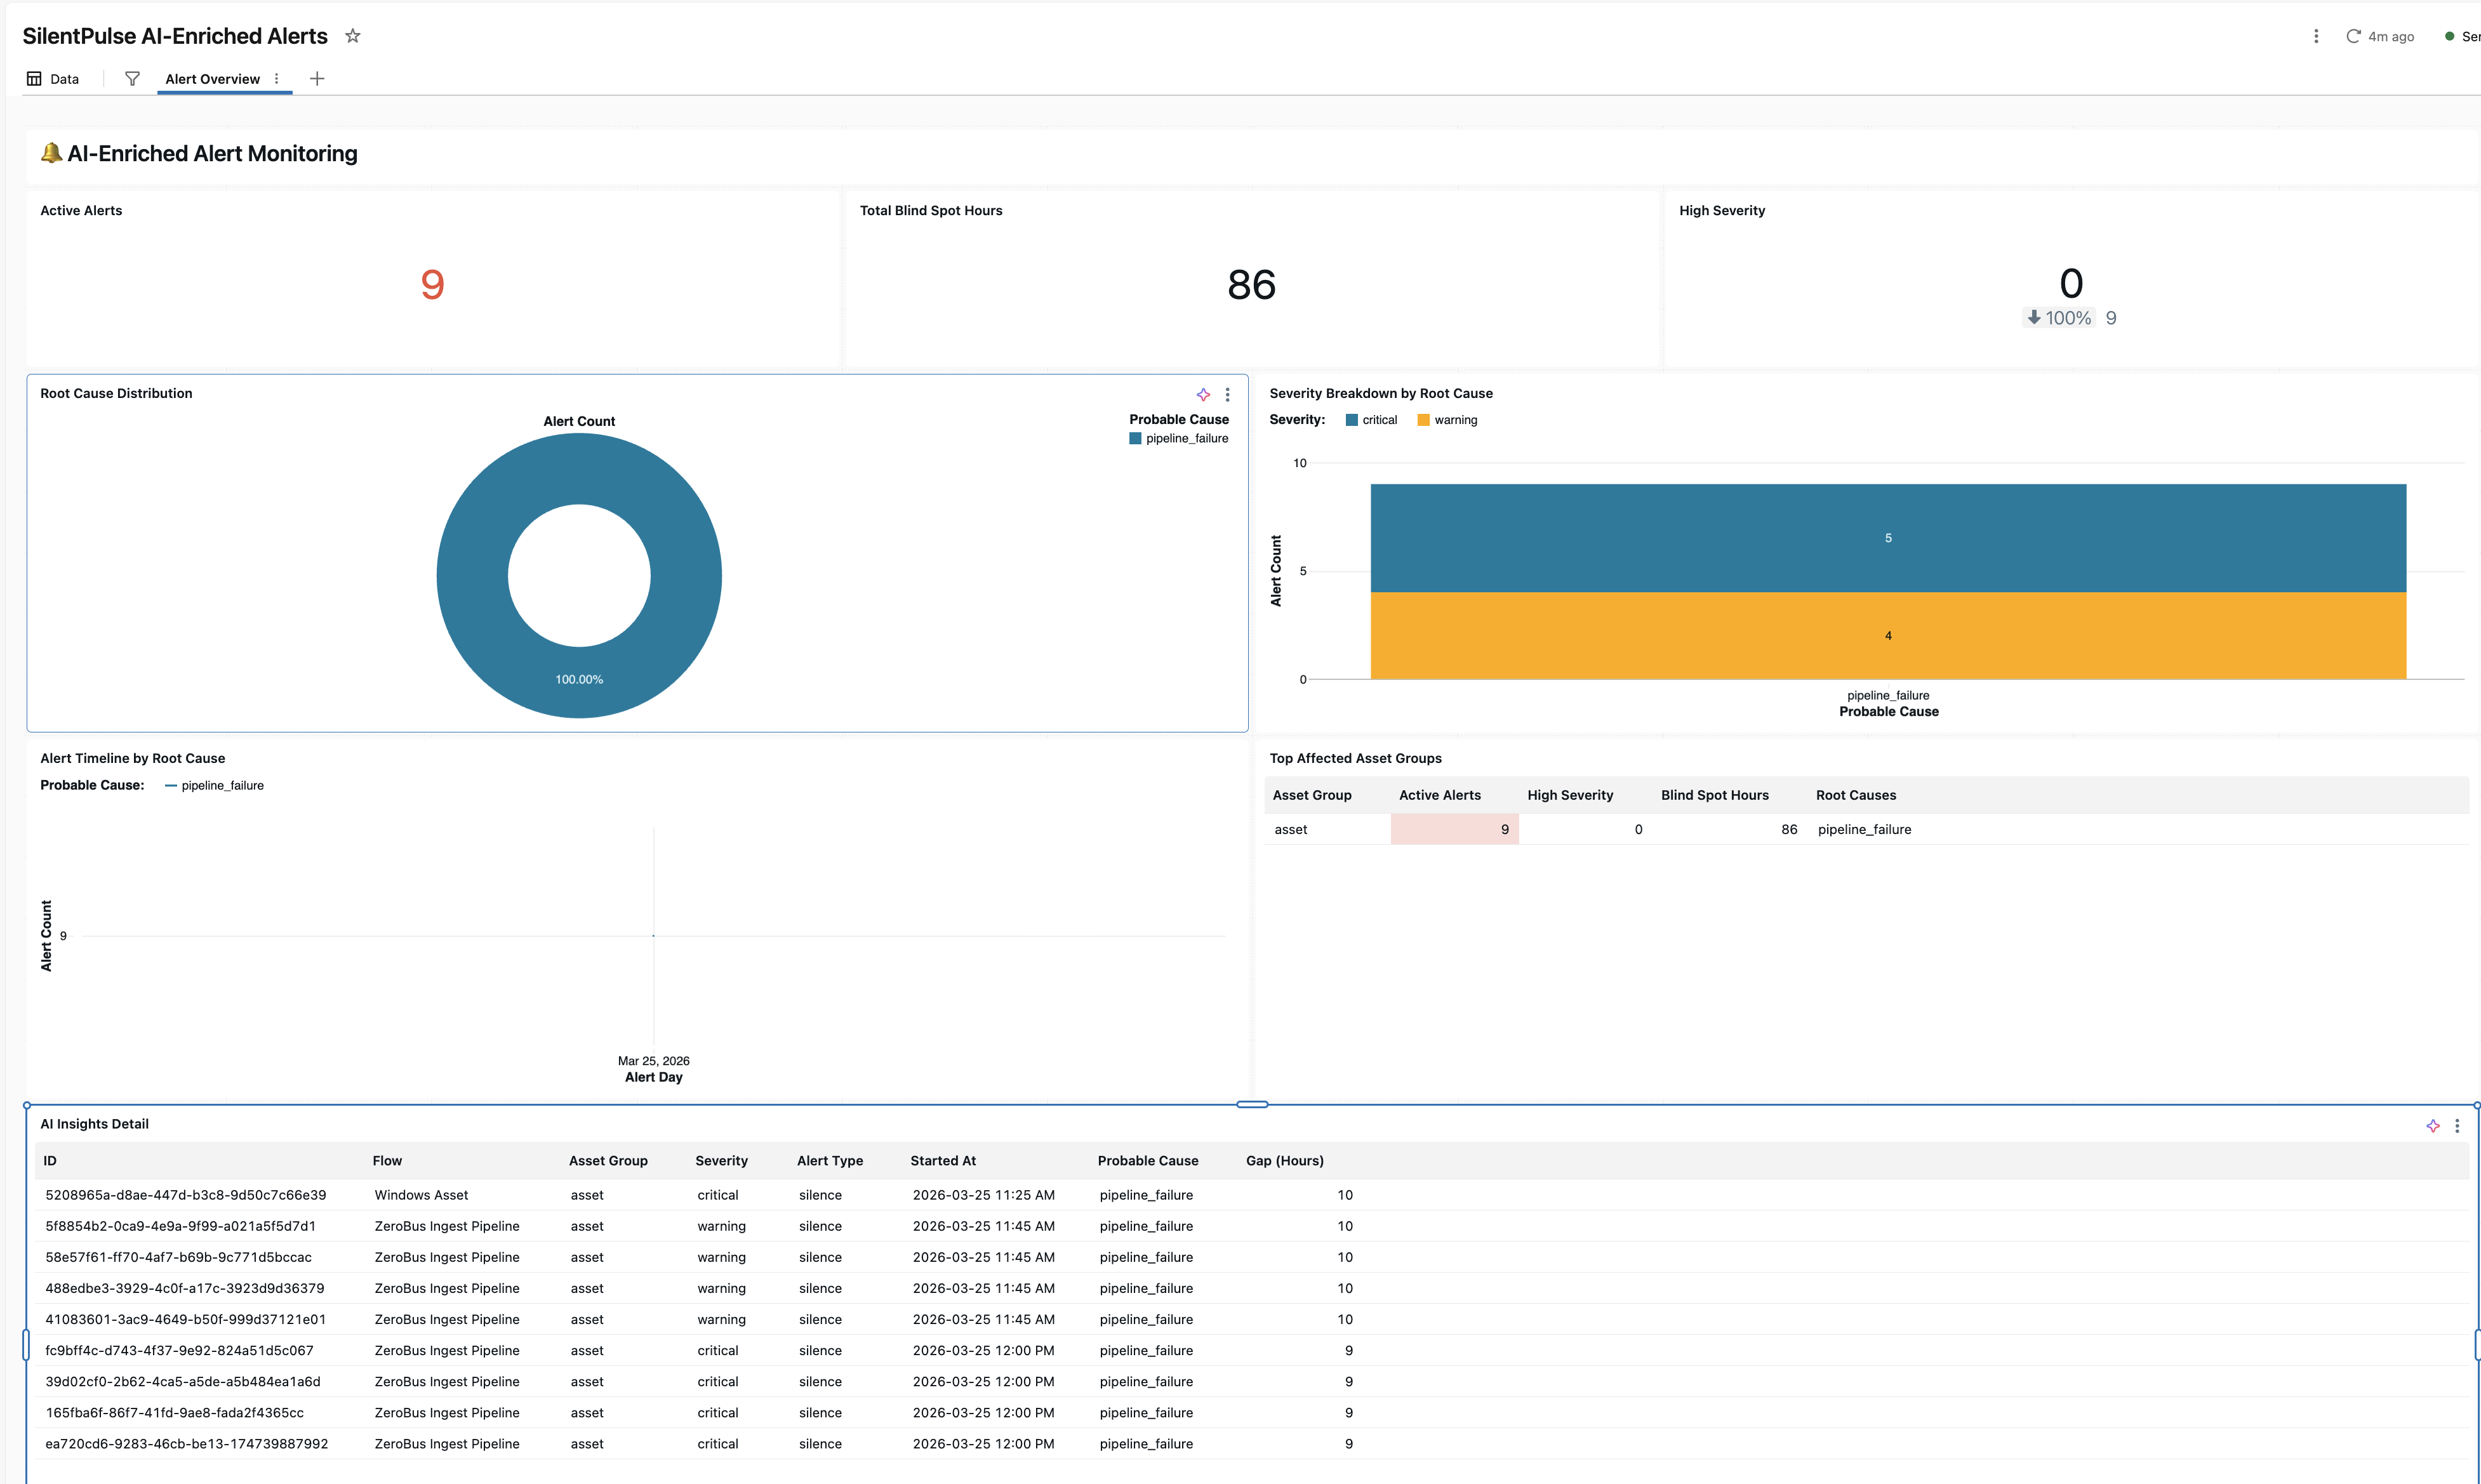
Feed everything into an AI/BI Dashboard for a single pane of glass across visibility gaps, root causes, and blind spot hours:
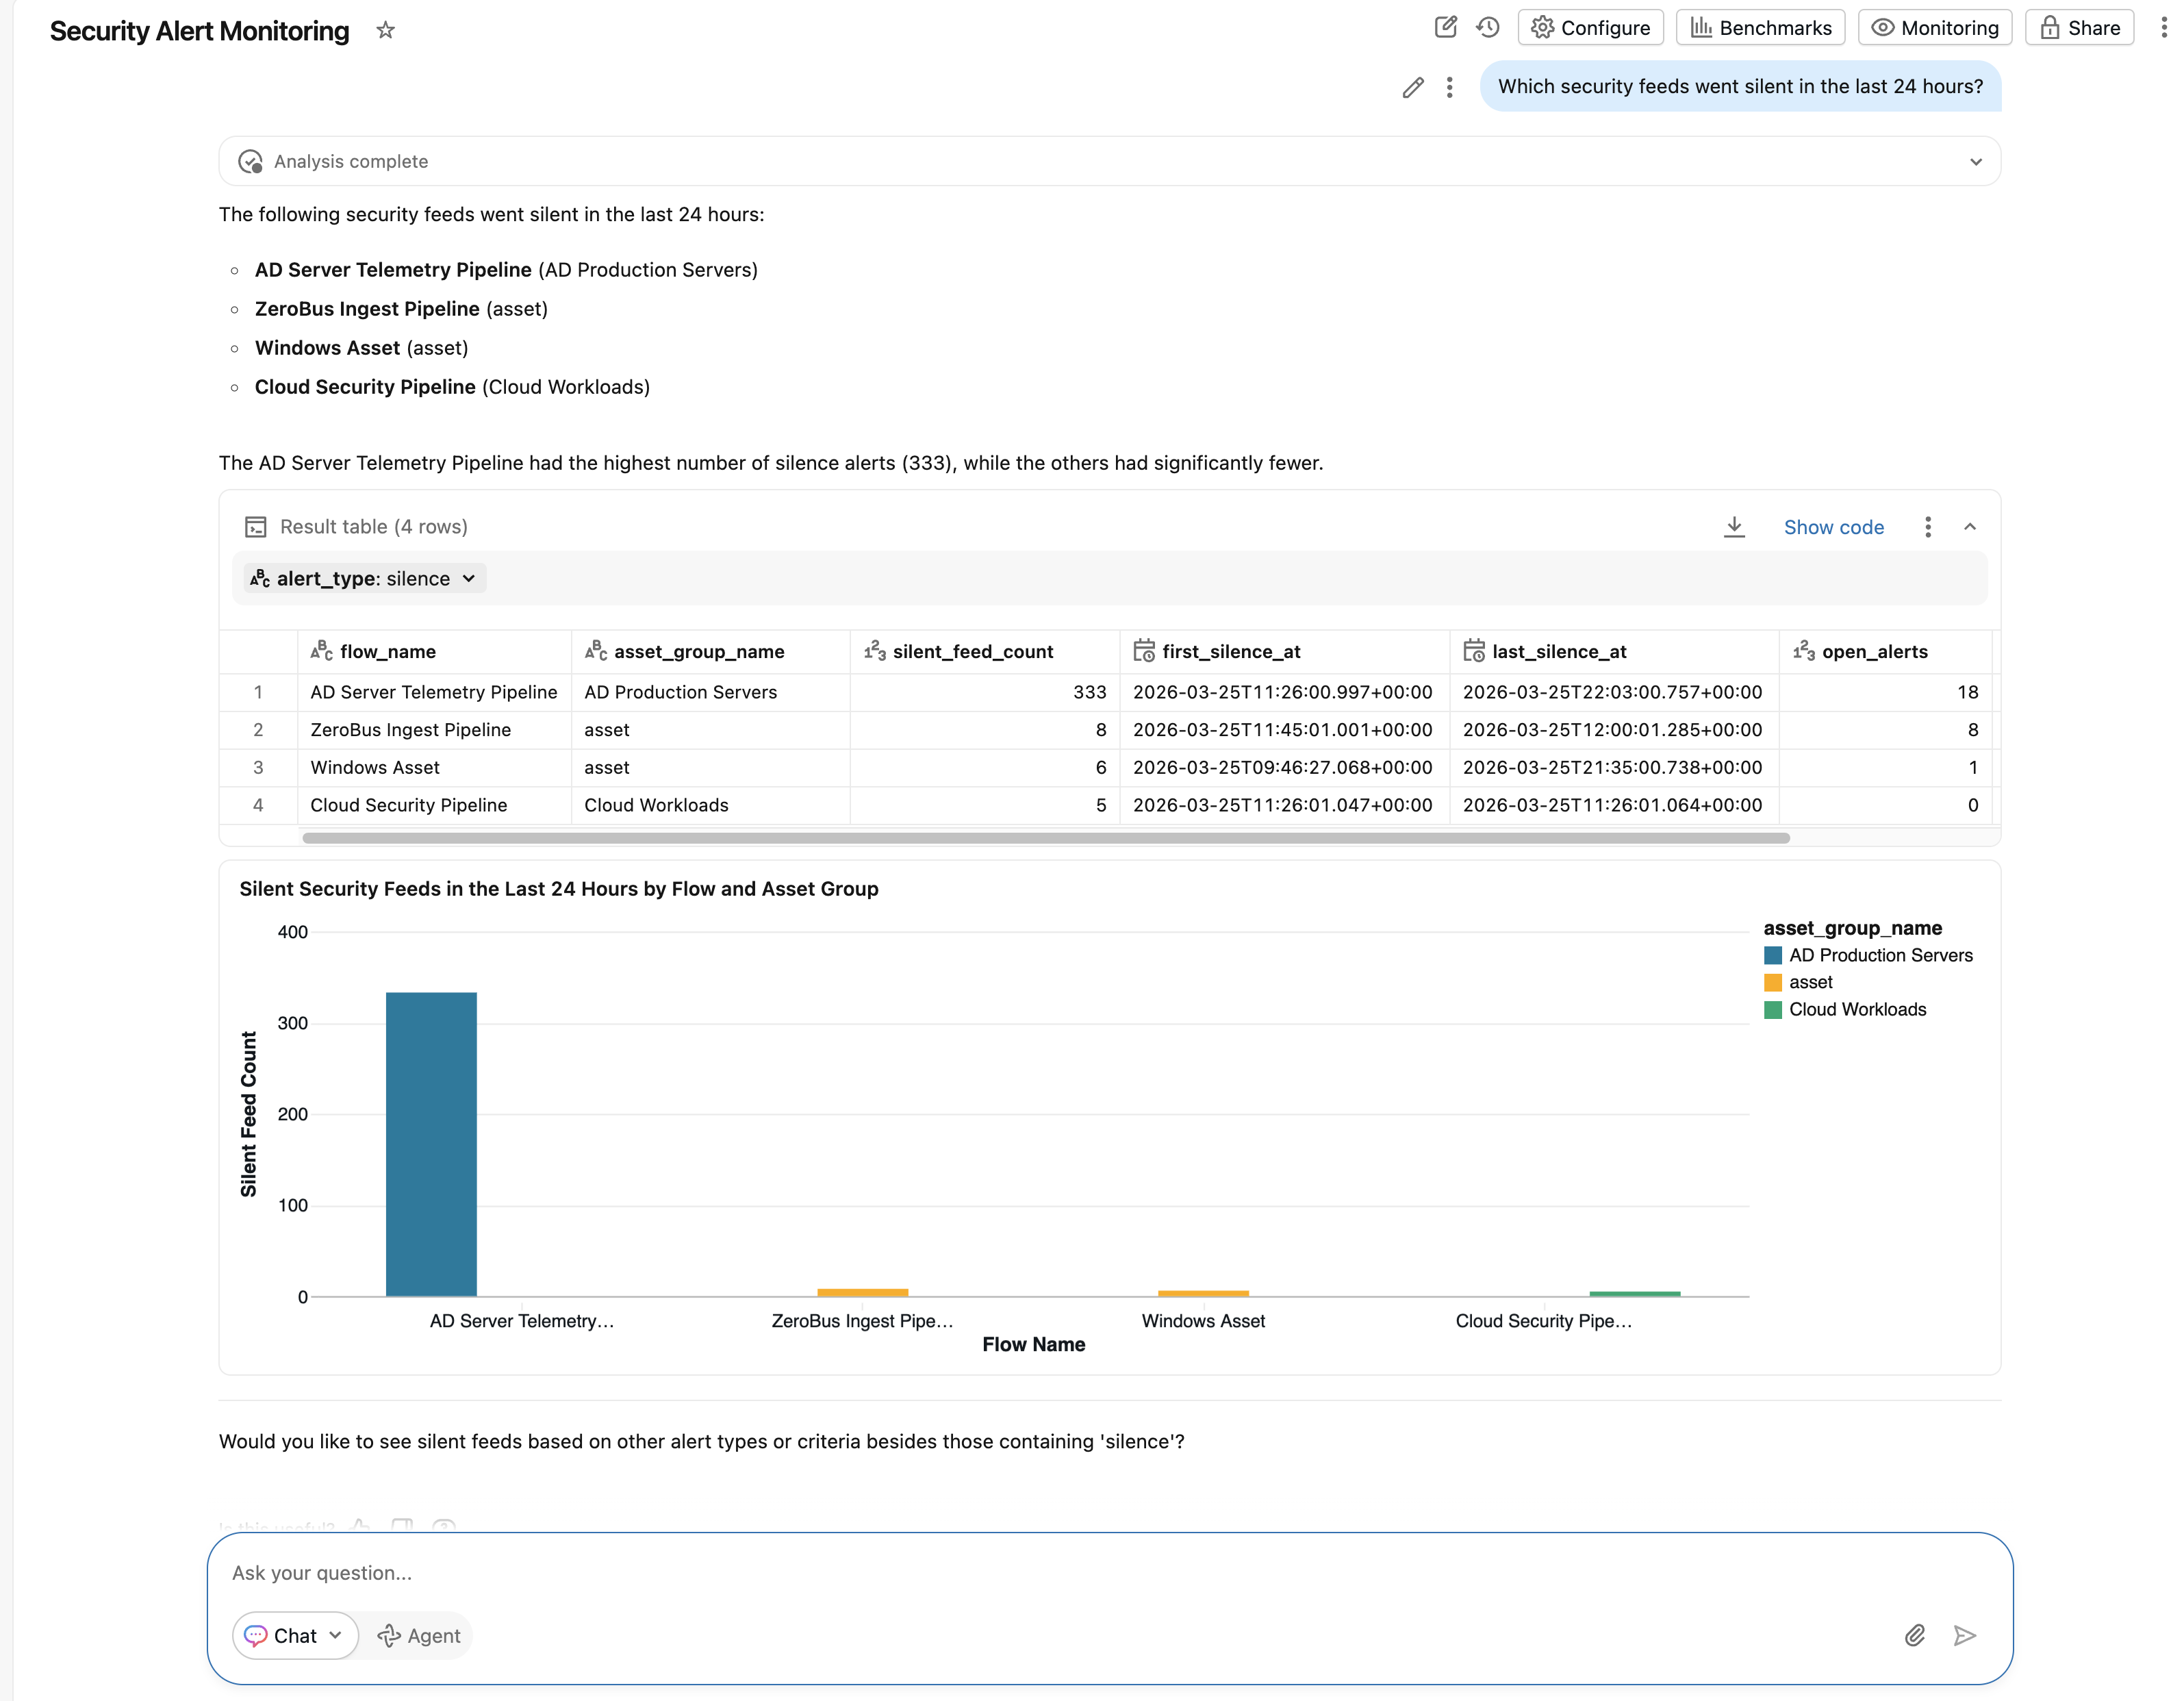
Materialize SilentPulse data as Metric Views in Unity Catalog, then point a Genie Space at them. Anyone on the team can ask “which security feeds went silent in the last 24 hours?” in plain English and get a table with a chart:
For the full walkthrough with all the code, metric views, Genie Space setup, and step-by-step instructions, see the detailed technical post on dere.la.
Get started
The silentpulse-databricks packages are available now:
pip install silentpulse-sdp
pip install silentpulse-datasource
pip install silentpulse-uc-discovery
Source code, examples, and documentation: github.com/silentpulse-io/silentpulse-databricks
If you’re running Lakewatch (or any SIEM on Databricks), SilentPulse makes sure you can trust the data feeding it. Because the best threat detection in the world is worthless if the telemetry never arrives.