In our previous posts, we described the problem, showed what we’re building, and analyzed real breaches where telemetry failures turned incidents into catastrophes.
This walkthrough is purely technical. It takes you from a raw asset inventory to a fully monitored environment with MITRE ATT&CK coverage mapping, step by step, with real screenshots from a running SilentPulse instance.
The scenario: an enterprise with 15 Active Directory domain-joined Windows servers. Security telemetry flows through a three-stage pipeline. Winlogbeat pushes events to Kafka, the SIEM team ingests them into Splunk, and the data engineering team lands everything in a Databricks lakehouse for long-term analytics. The CISO wants to answer one question: “If telemetry stops flowing at any stage in this pipeline, how quickly do we know, and what detection capabilities do we lose?”
This is how you build that answer.
Step 1: Import your asset inventory
SilentPulse needs to know what it should be monitoring. The starting point is always the same: your existing asset inventory.
You don’t need a perfect CMDB. You don’t need to manually enter thousands of hostnames. SilentPulse supports three import methods that meet you where your data already lives:
Active Directory Sync. Point SilentPulse at your AD domain controllers. It pulls computer objects, organizational units, and attributes directly. Your Windows servers appear automatically, grouped by OU, tagged by AD attributes like department and server role.
CSV Import. Export your CMDB, ServiceNow, or cloud inventory to a CSV file. Map columns to SilentPulse fields (hostname, IP, OS, environment, department). Bulk import thousands of assets in seconds.
API Push. Your CMDB or asset management platform pushes updates to SilentPulse via REST API. Every time an asset is provisioned, decommissioned, or modified, the change flows automatically. No stale spreadsheets.
For our walkthrough, we use AD sync. After import, 15 Windows servers appear in SilentPulse: domain controllers (DC-PROD-01, DC-PROD-02), application servers (SRV-APP-01 through SRV-APP-03), file servers, SQL servers, web servers, the Exchange server, ADFS, and SCCM. Each carries its OU, department, OS version, and IP address as structured traits.
Step 2: Define observation types
Before you can monitor telemetry, SilentPulse needs to understand what kinds of things you’re monitoring. Observation types are categories of assets that share the same monitoring characteristics.
For our enterprise, we define three observation types:
| Observation Type | Icon | Key Traits |
|---|---|---|
| Windows Server | server | hostname, IP, OS version, OU, department |
| Network Device | router | hostname, IP, device type, location, vendor |
| Cloud Workload | cloud | instance ID, IP, provider, region, service |
Each observation type defines a display trait (how the entity shows up in lists, for example hostname for servers or instance_id for cloud workloads) and match keys (how SilentPulse correlates entities across data sources). A Windows Server is matched by hostname. A Cloud Workload is matched by instance_id.
These traits become the filters you use to build targeted monitoring groups in the next step.
Step 3: Create observability groups
Observability groups are filtered subsets of your assets, and each group gets its own monitoring configuration, availability targets, and security function mappings. This is where SilentPulse starts showing real value.
You don’t monitor “all servers” with one rule. You create precise groups that reflect how your organization actually thinks about its infrastructure:
AD Production Servers. All 15 Windows servers from Active Directory where vendor = Microsoft. Domain controllers, file servers, application servers, SQL servers. KPI target: 99.5% daily availability.
Network Infrastructure. Firewalls (FW-CORE-01, FW-DMZ-01), switches (SW-DIST-01, SW-DIST-02), and the WAN router (RTR-WAN-01). Different vendor mix (Palo Alto, Cisco, Juniper), different monitoring cadence. KPI target: 99.9% daily.
Cloud Workloads. Five VMs across AWS and Azure. Known for autoscaling and ephemeral instances, so the availability expectation is different. KPI target: 95.0% weekly.
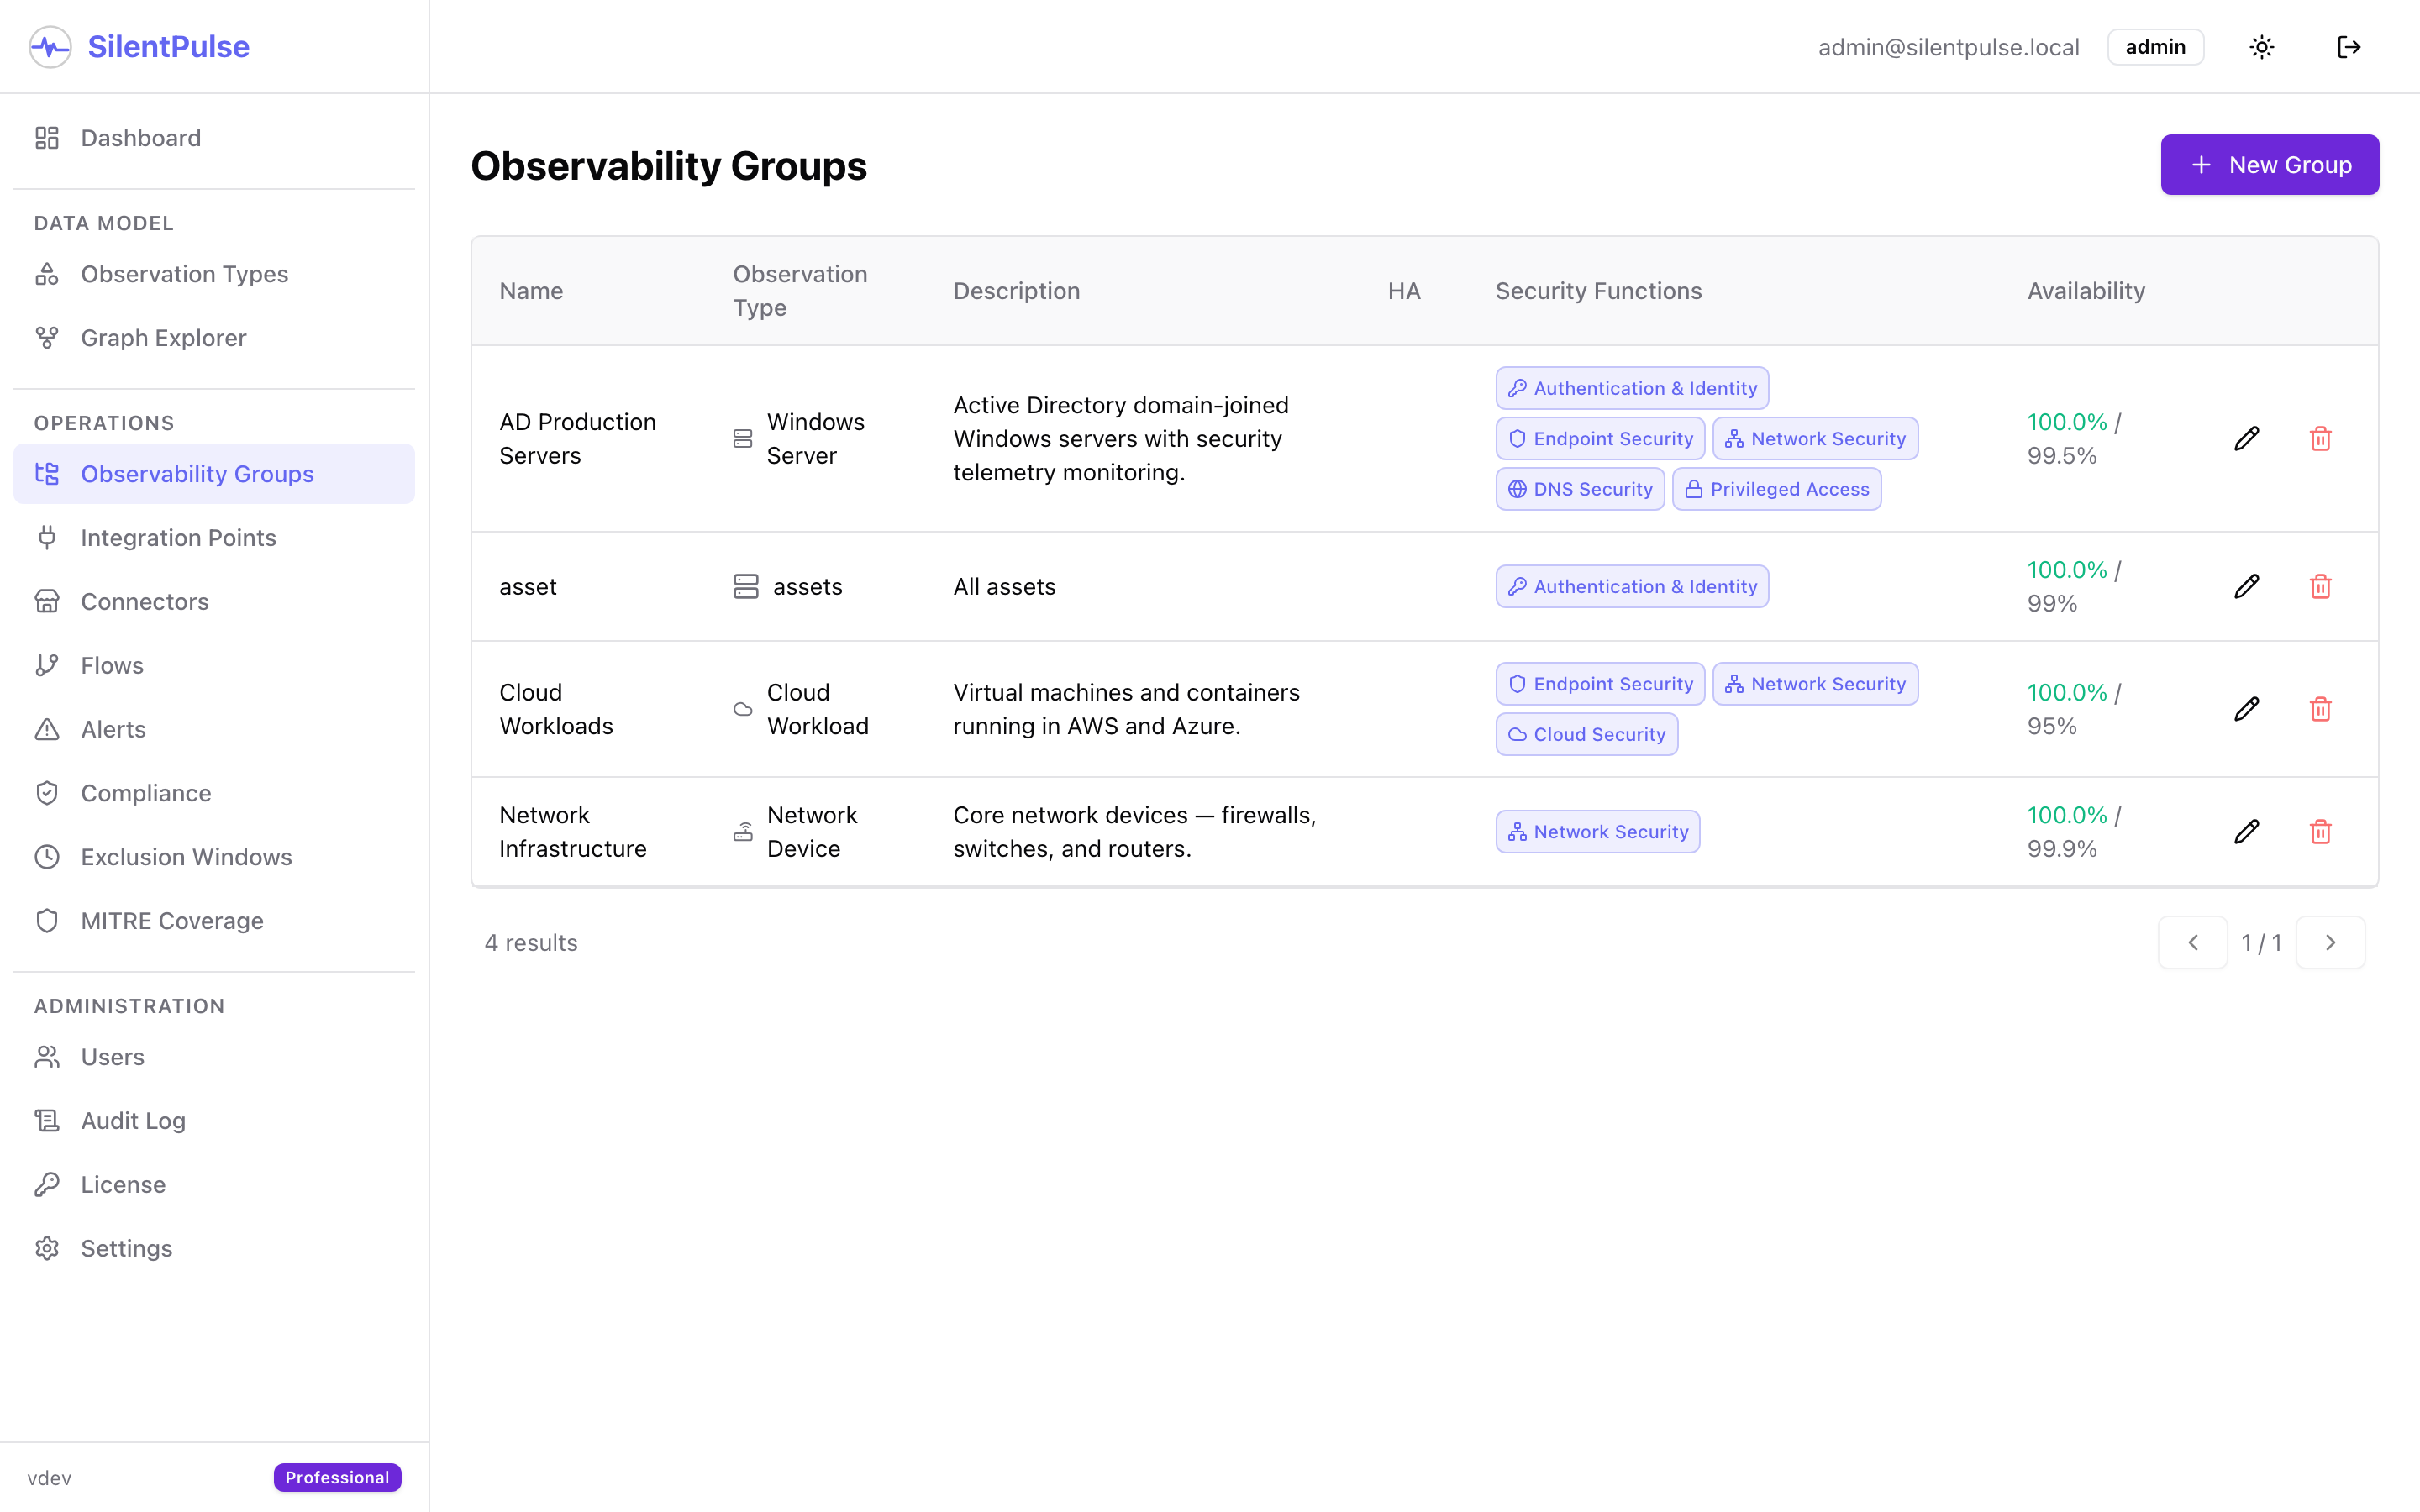
Each group gets an availability target, the minimum acceptable telemetry uptime. SilentPulse measures actual availability against these targets continuously and flags compliance breaches the moment a group drops below its SLA.
Step 4: Map security functions
This is the step that transforms SilentPulse from “is the data flowing?” to “what can we no longer detect?”
Each observability group is mapped to the security functions it supports. SilentPulse ships with pre-defined security functions aligned to standard security capabilities:
| Security Function | What It Covers |
|---|---|
| Endpoint Security | EDR, antimalware, host-based detection |
| Network Security | IDS/IPS, NetFlow, packet capture |
| Authentication & Identity | AD logs, SSO, MFA, privilege use |
| DNS Security | DNS query logs, tunneling detection |
| Cloud Security | Cloud workload telemetry, CSPM |
| Privilege Management | PAM, admin activity, elevation tracking |
For our groups, the mappings look like this:
- AD Production Servers maps to Endpoint Security, Network Security, Authentication & Identity, DNS Security, Privilege Management
- Network Infrastructure maps to Network Security
- Cloud Workloads maps to Cloud Security, Endpoint Security, Network Security
When a server in the “AD Production Servers” group stops producing telemetry, SilentPulse doesn’t just say “server is silent.” It says: “Endpoint Security, Network Security, Authentication, DNS, and Privilege Management are degraded in this segment.”
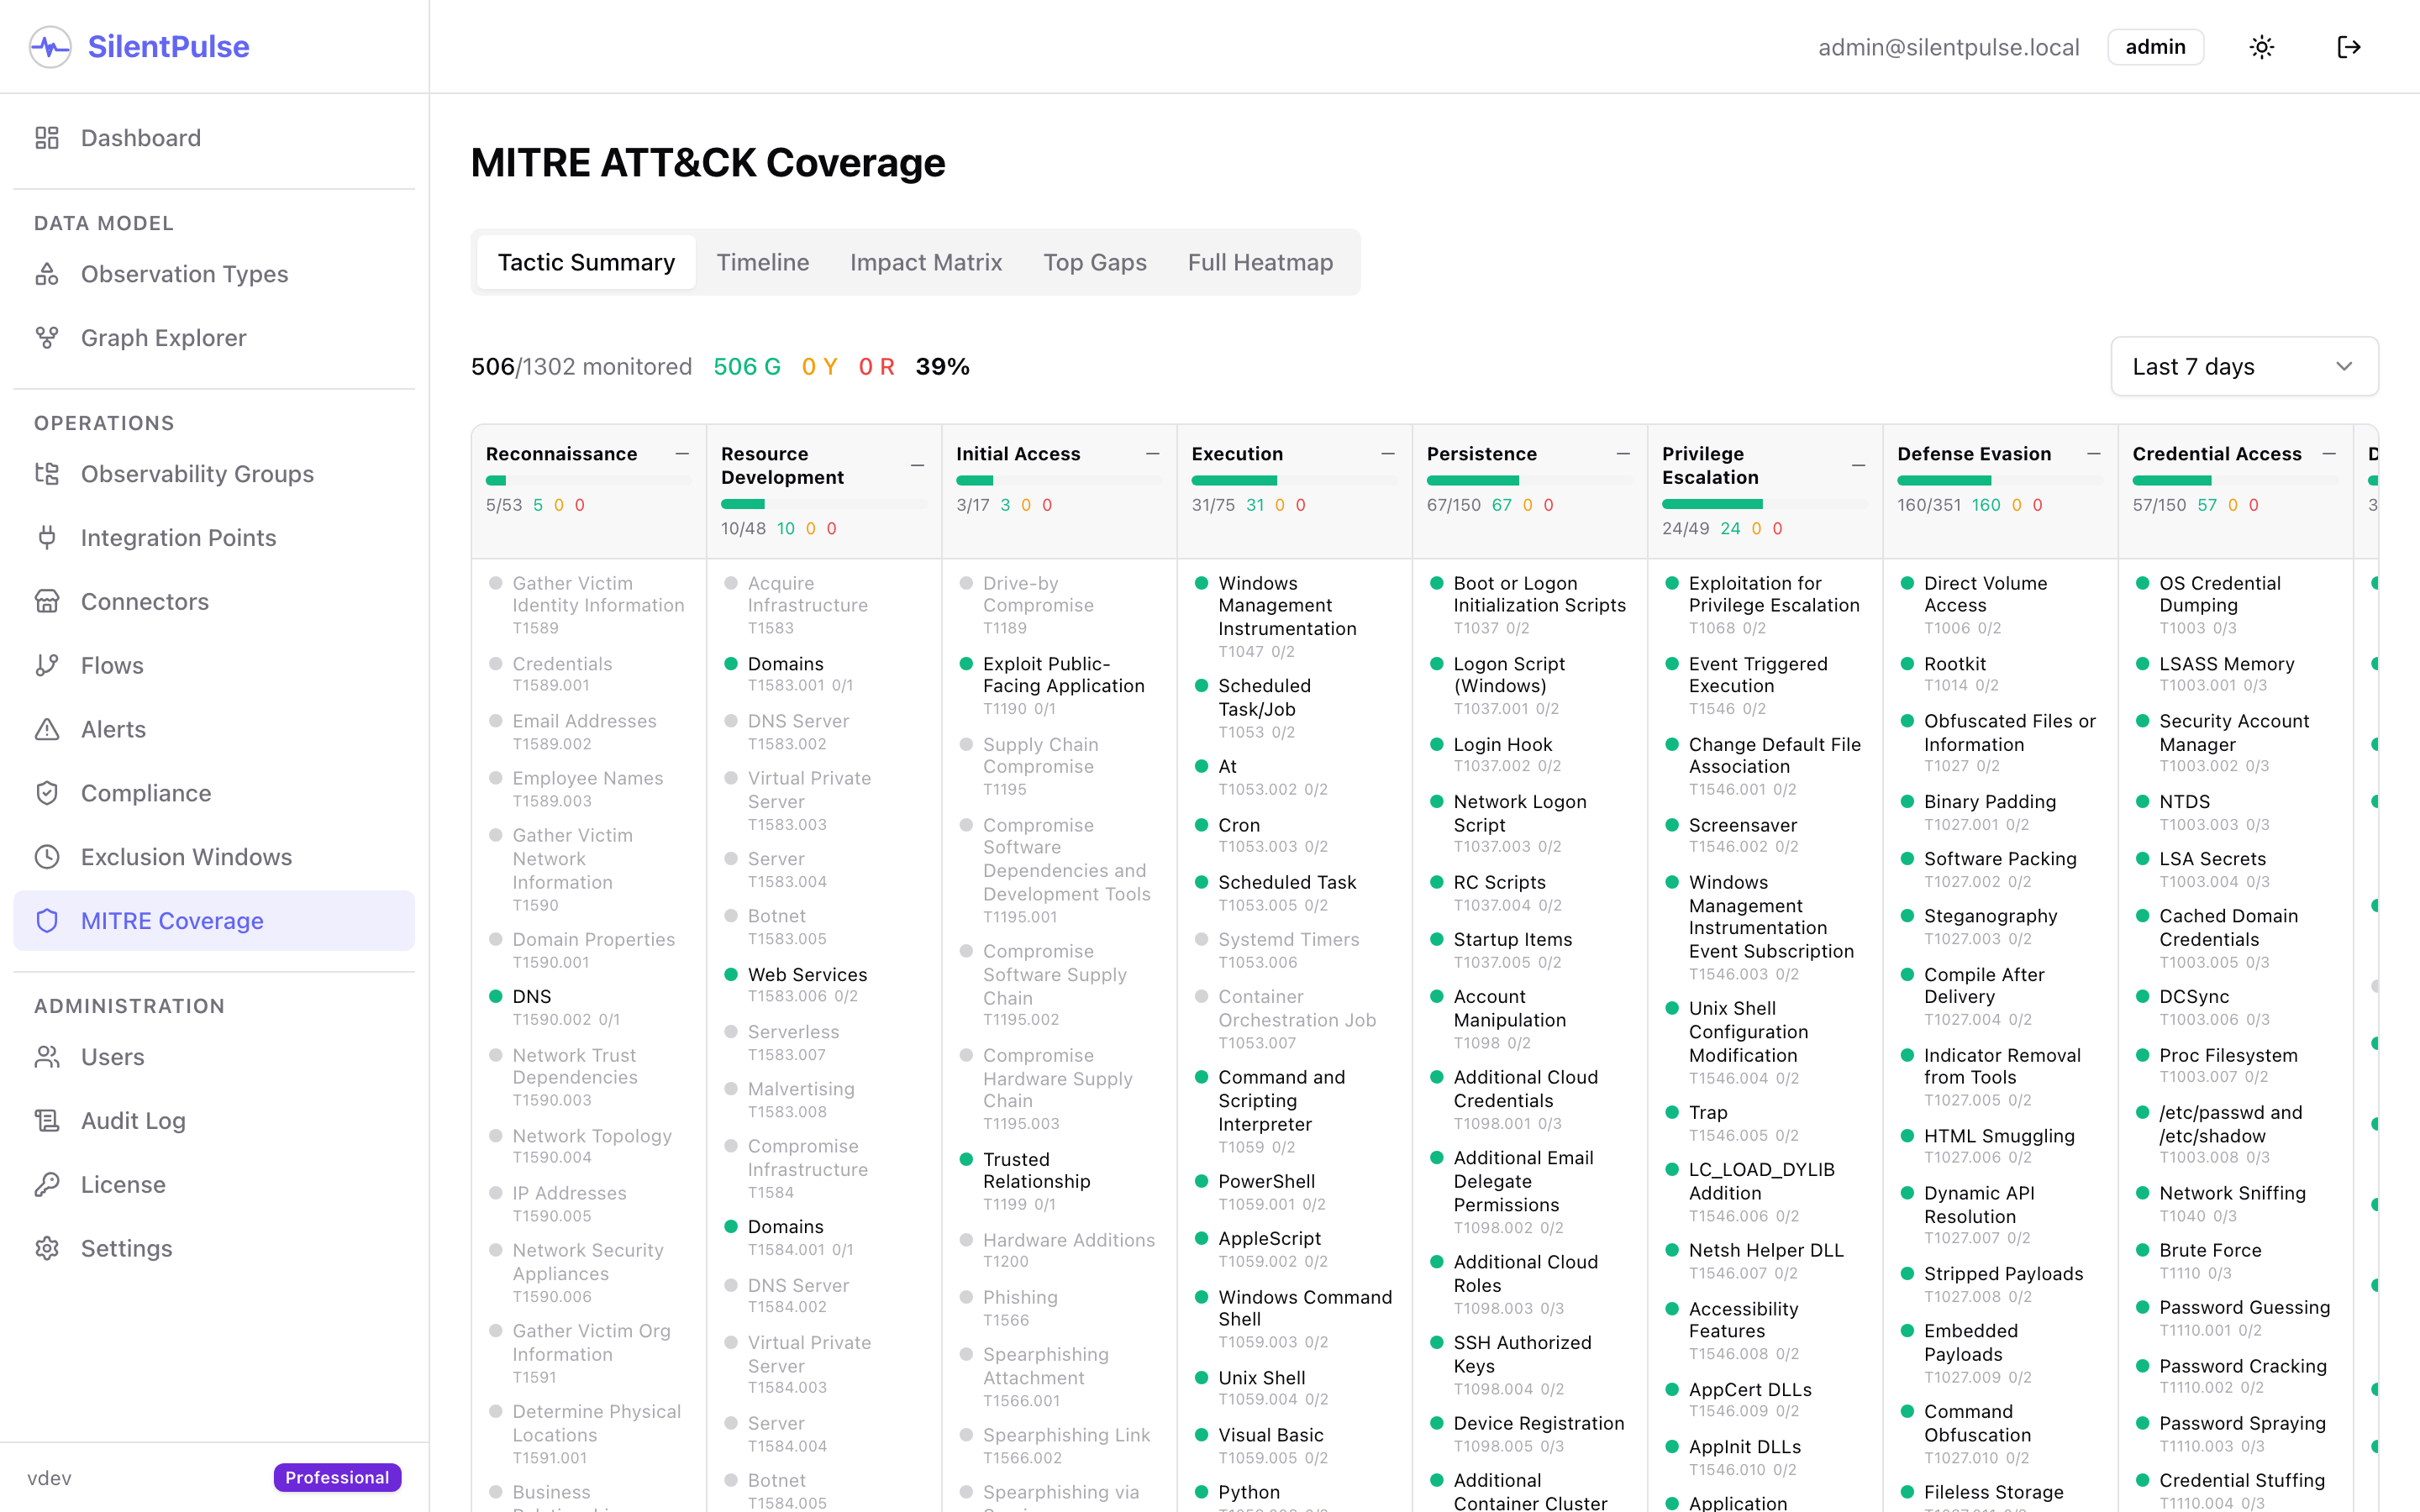
Because each security function is mapped to MITRE ATT&CK techniques, the impact cascades all the way to: “23 MITRE techniques are now unmonitored in this segment, including T1003 (Credential Dumping), T1021 (Remote Services), and T1078 (Valid Accounts).”
Step 5: Connect your data sources
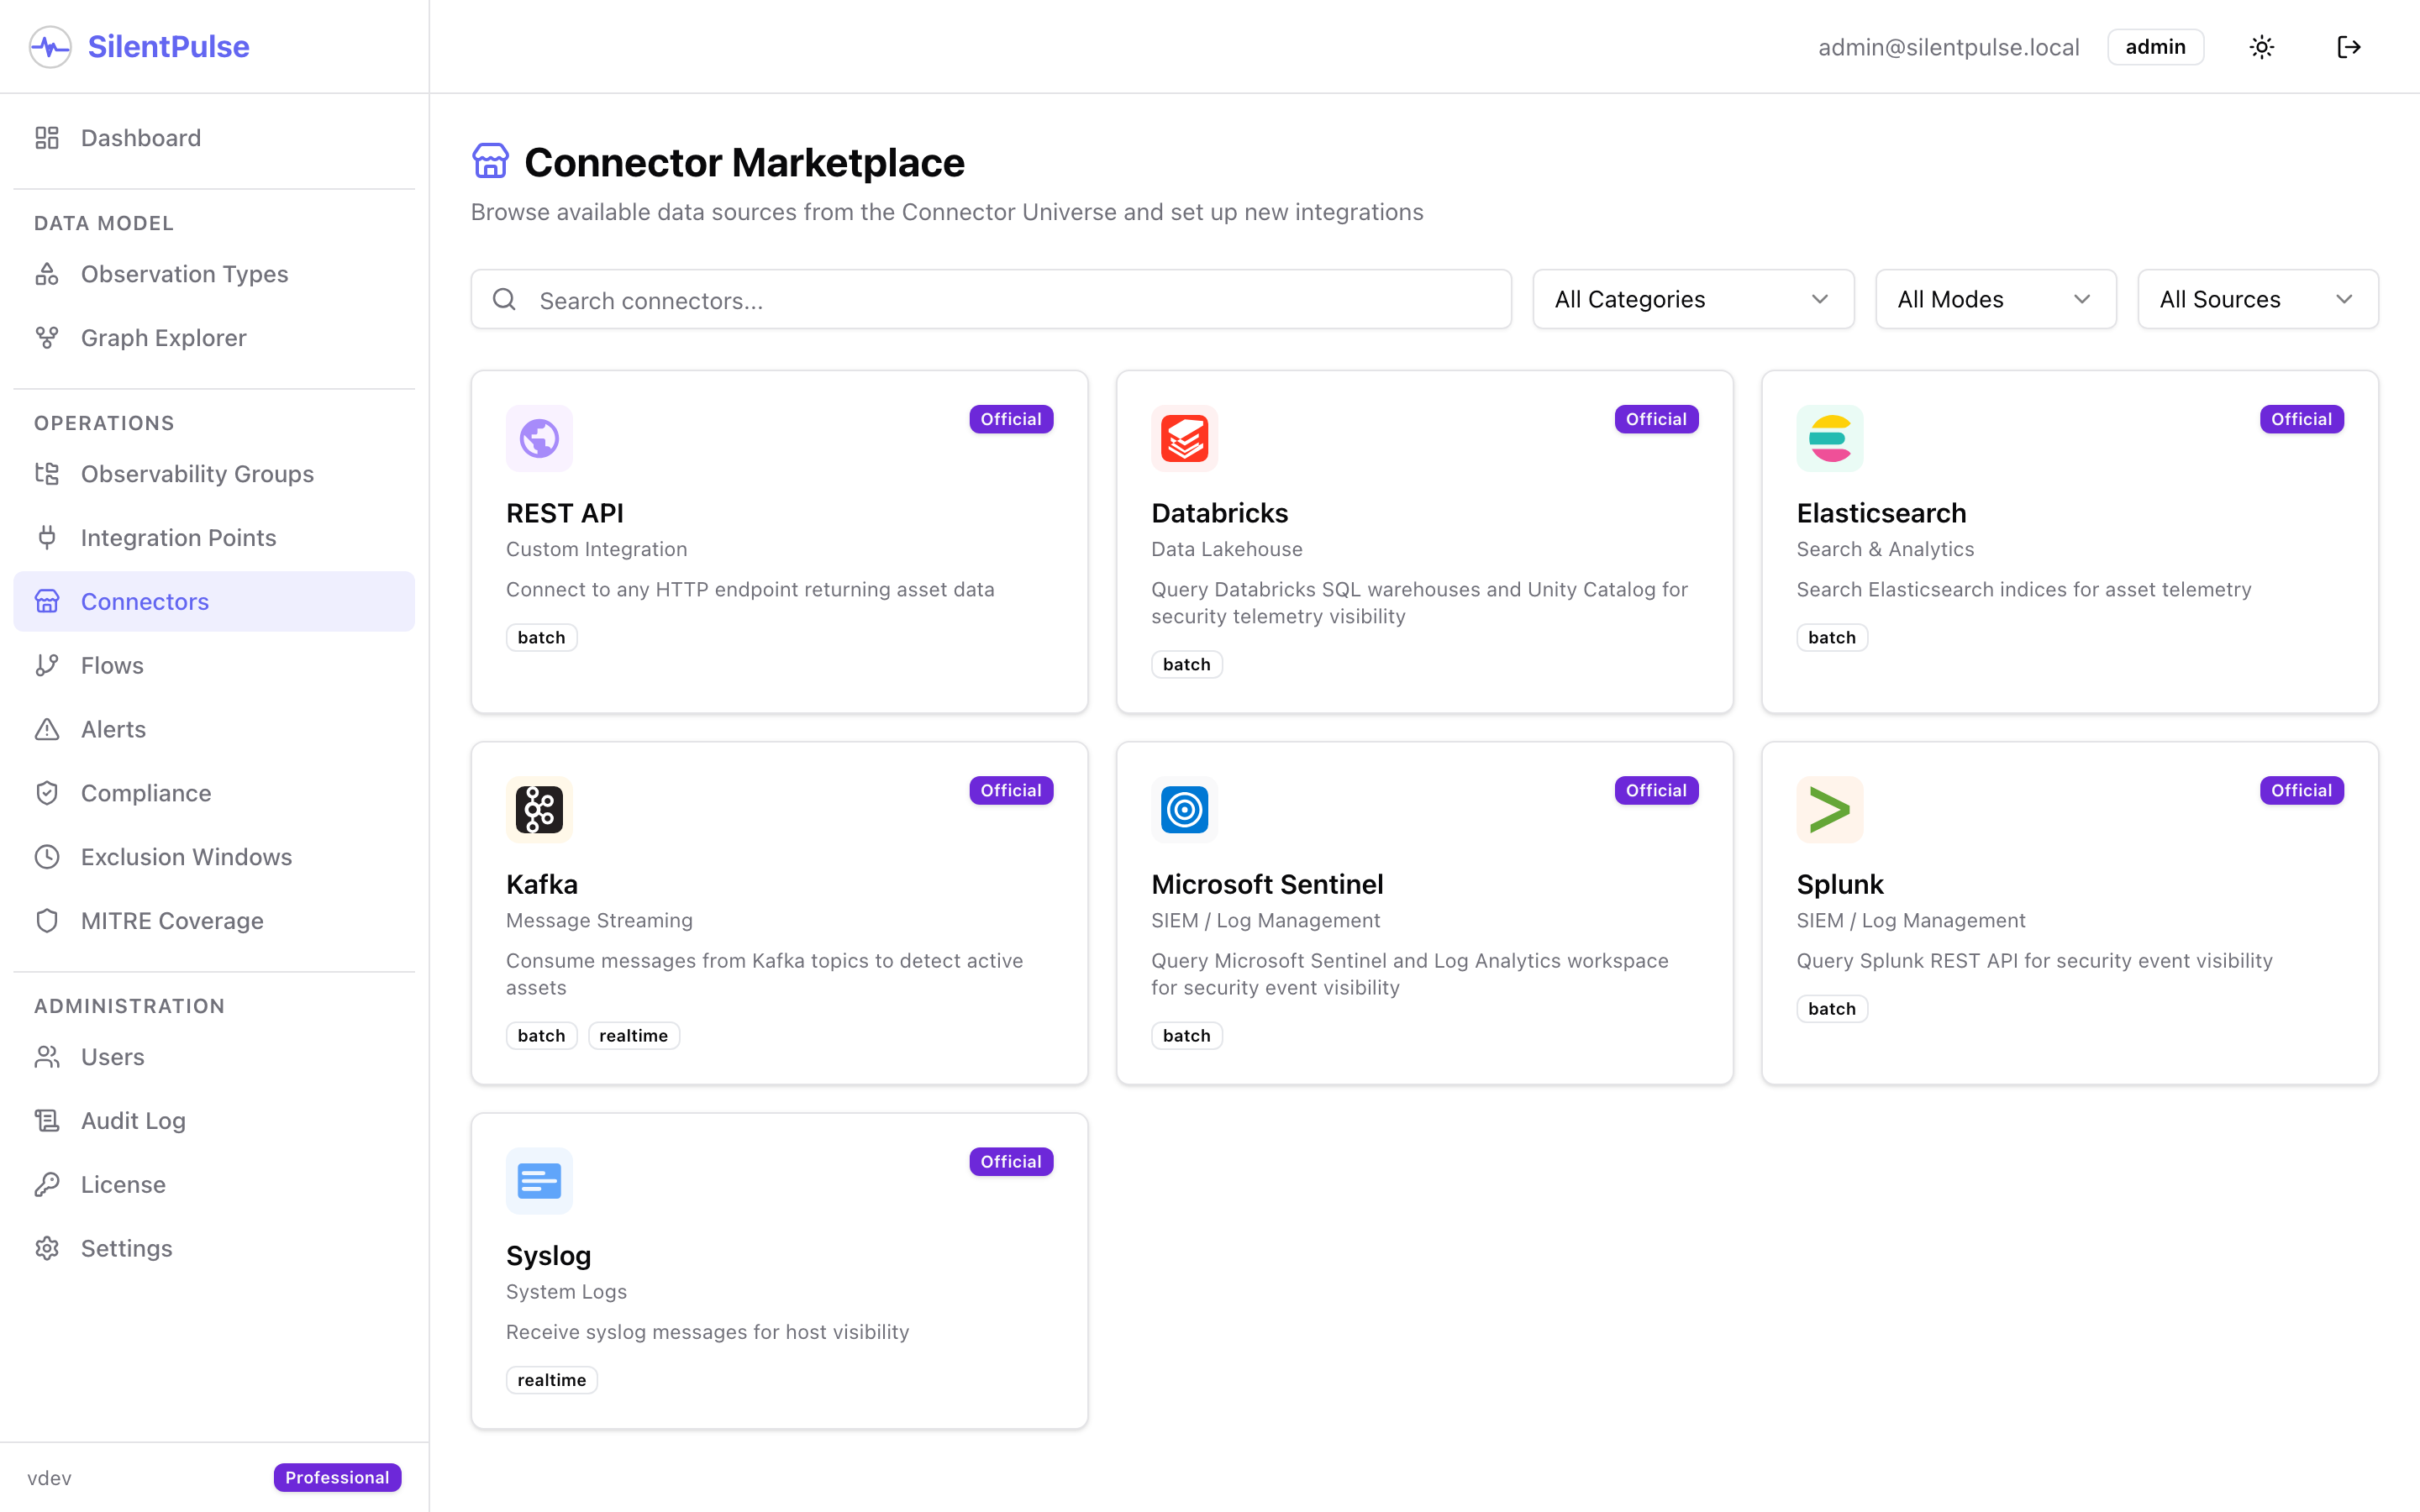
SilentPulse needs to check whether telemetry is actually arriving at each stage of the pipeline. This is where integration points come in, the connections to the systems where your security data lives.
For our AD server pipeline, we configure three integration points using real connector types:
Kafka, Windows Security Events. Winlogbeat agents on each Windows server push security events to a Kafka topic (windows-security-events). SilentPulse connects to the Kafka cluster and checks: “Is this hostname actively producing messages?”
Splunk, Enterprise SIEM. The SIEM team consumes from Kafka and indexes events in Splunk. SilentPulse connects via the Splunk REST API and queries the wineventlog index: “Has this hostname appeared in the last 45 seconds?”
Databricks, Security Lakehouse. A Spark ETL job moves data from Splunk to a Databricks lakehouse for long-term analytics. SilentPulse queries the security.telemetry catalog: “Has this hostname been processed in the last 90 seconds?”
Three connectors, one pipeline, end-to-end visibility. If Winlogbeat stops sending, you know at the source. If the Kafka-to-Splunk consumer breaks, you know at the SIEM. If the ETL job fails, you know at the lakehouse.
Step 6: Build the monitoring flow
A flow ties everything together. It defines which group of assets should be checked, against which data sources, how often, and what to do when something goes silent.
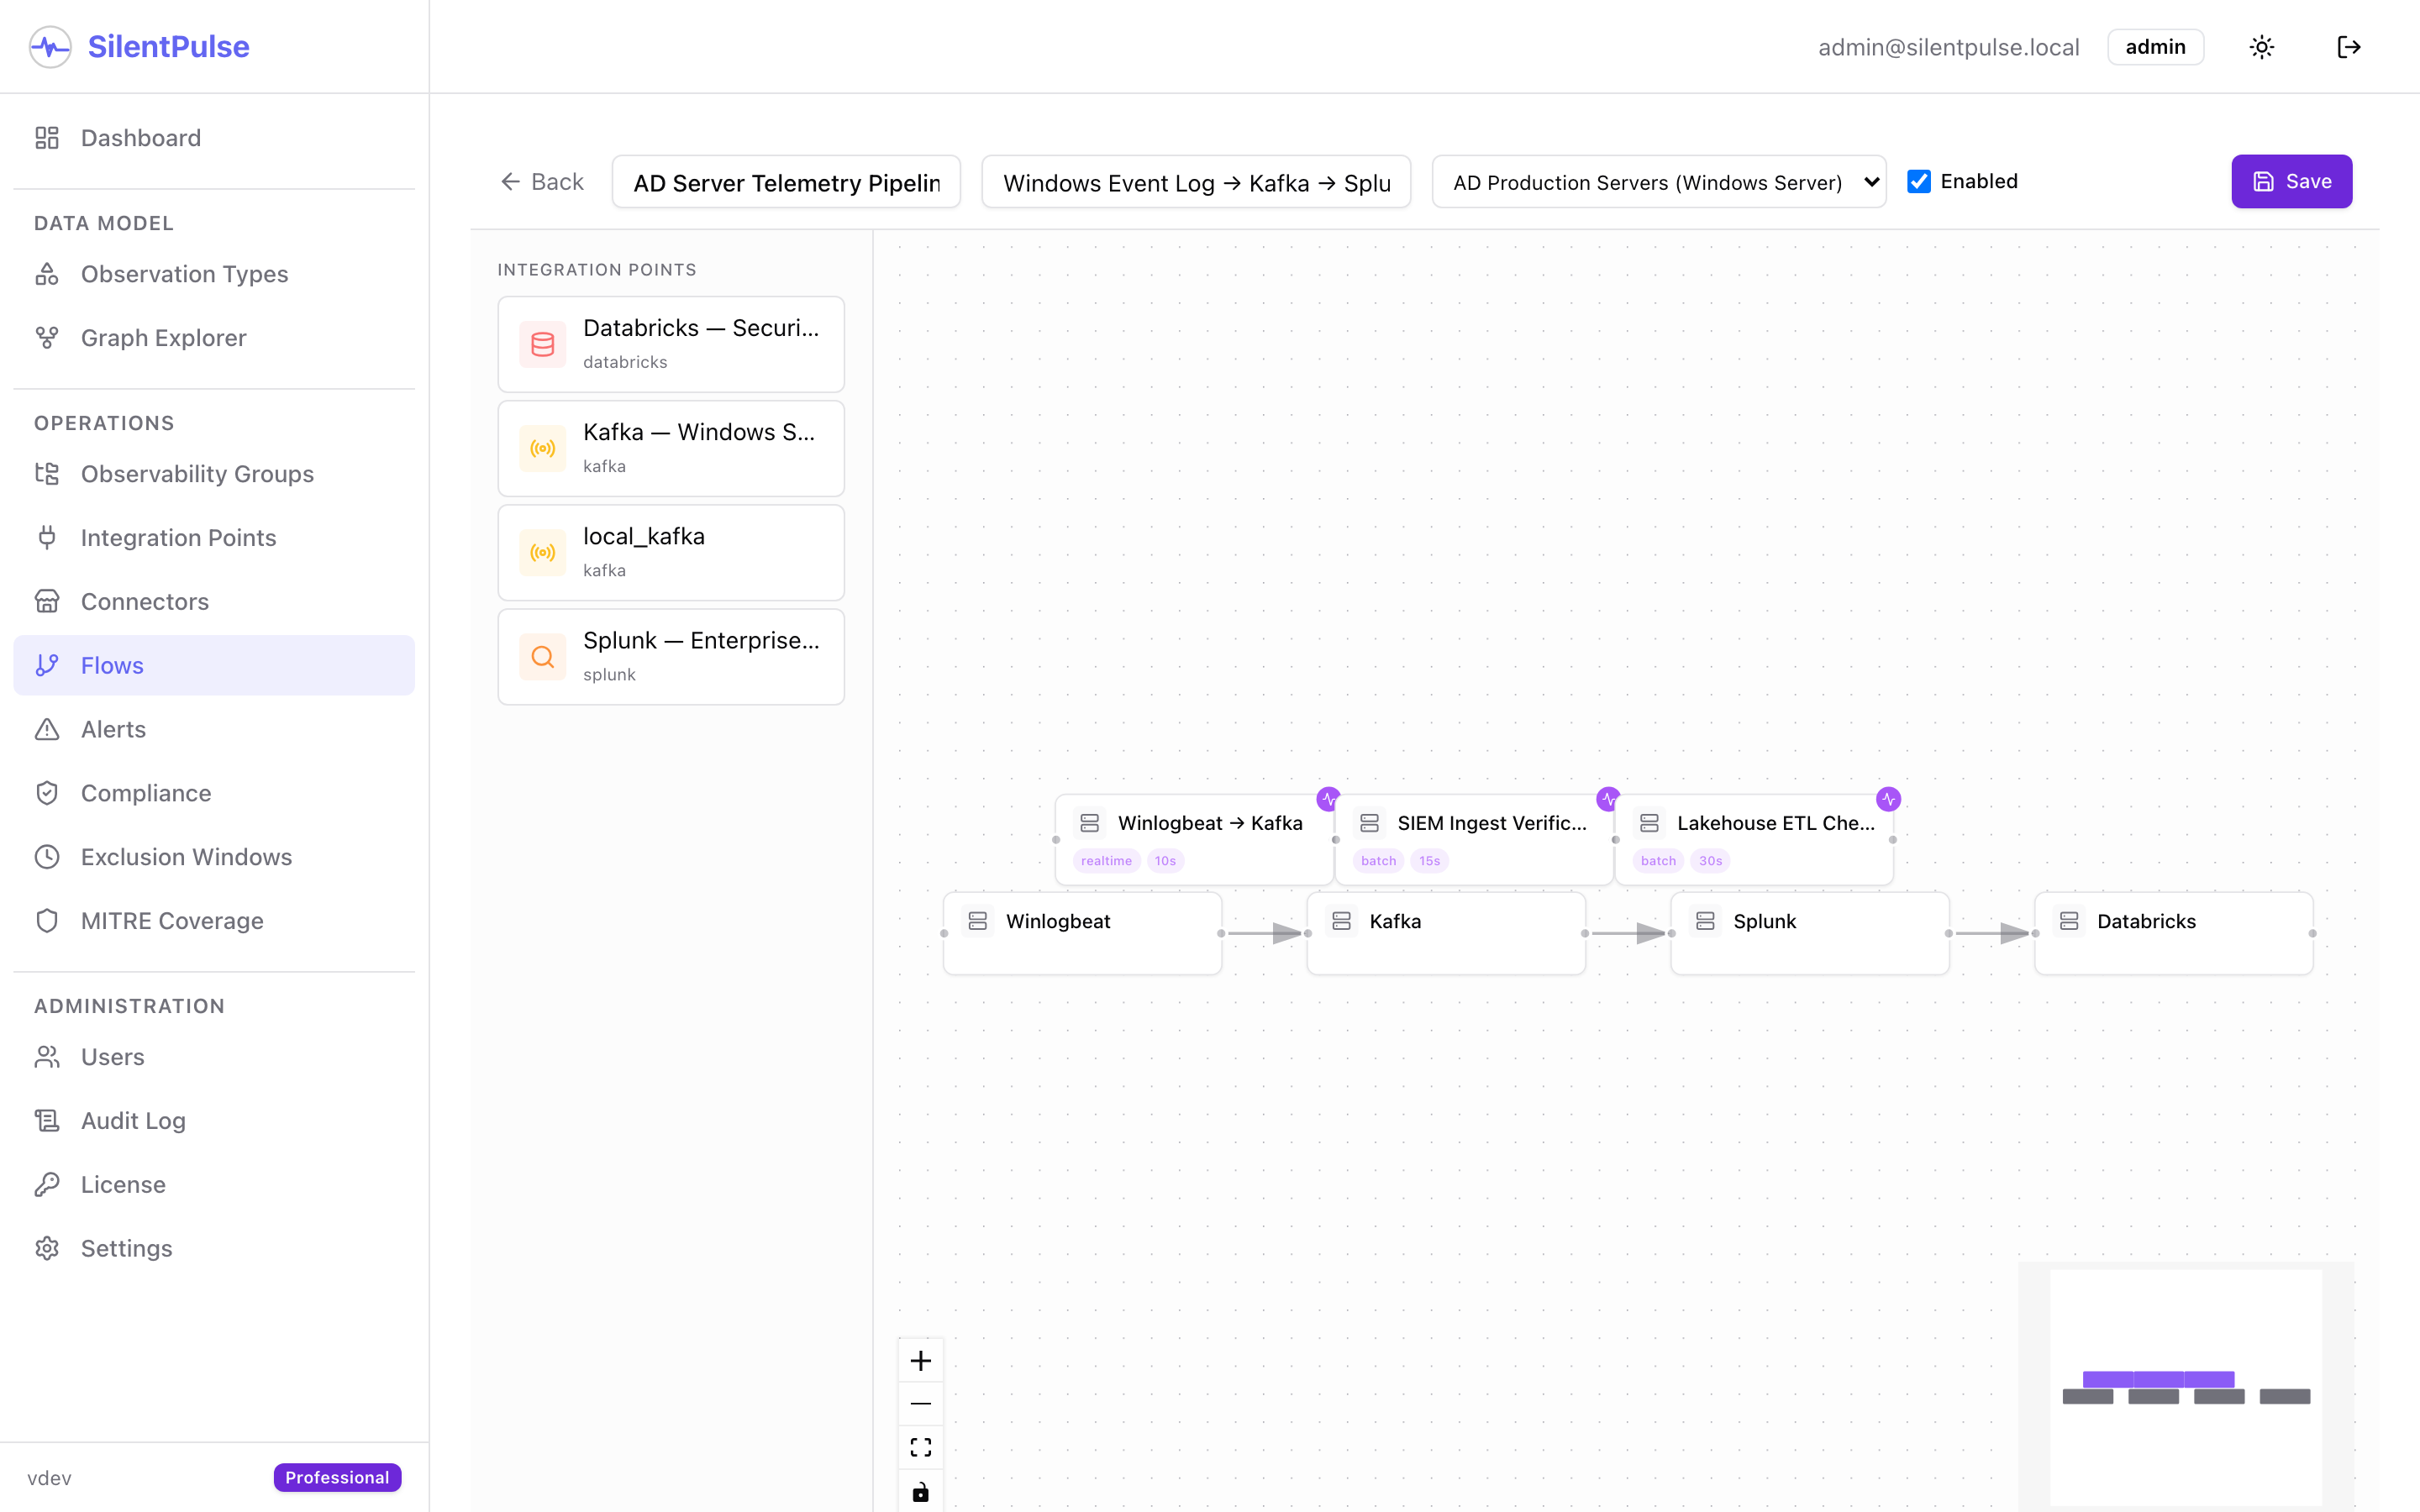
For our AD Production Servers, the flow, “AD Server Telemetry Pipeline”, has three pulses tracking the complete data path:
| Pulse | Integration Point | Interval | Time Window | Mode |
|---|---|---|---|---|
| Winlogbeat to Kafka | Kafka | 10s | 30s | realtime |
| SIEM Ingest Verification | Splunk | 15s | 45s | batch |
| Lakehouse ETL Check | Databricks | 30s | 90s | batch |
The visual editor shows the pipeline left-to-right: Kafka, then Splunk, then Databricks. Reference edges show the real data flow. Winlogbeat pushes to Kafka, the Kafka consumer feeds Splunk, and a Spark ETL job lands data in Databricks.
A second flow, “Network Monitoring”, covers the network infrastructure group with a single Splunk pulse, keeping the Flows dashboard populated with two cards.
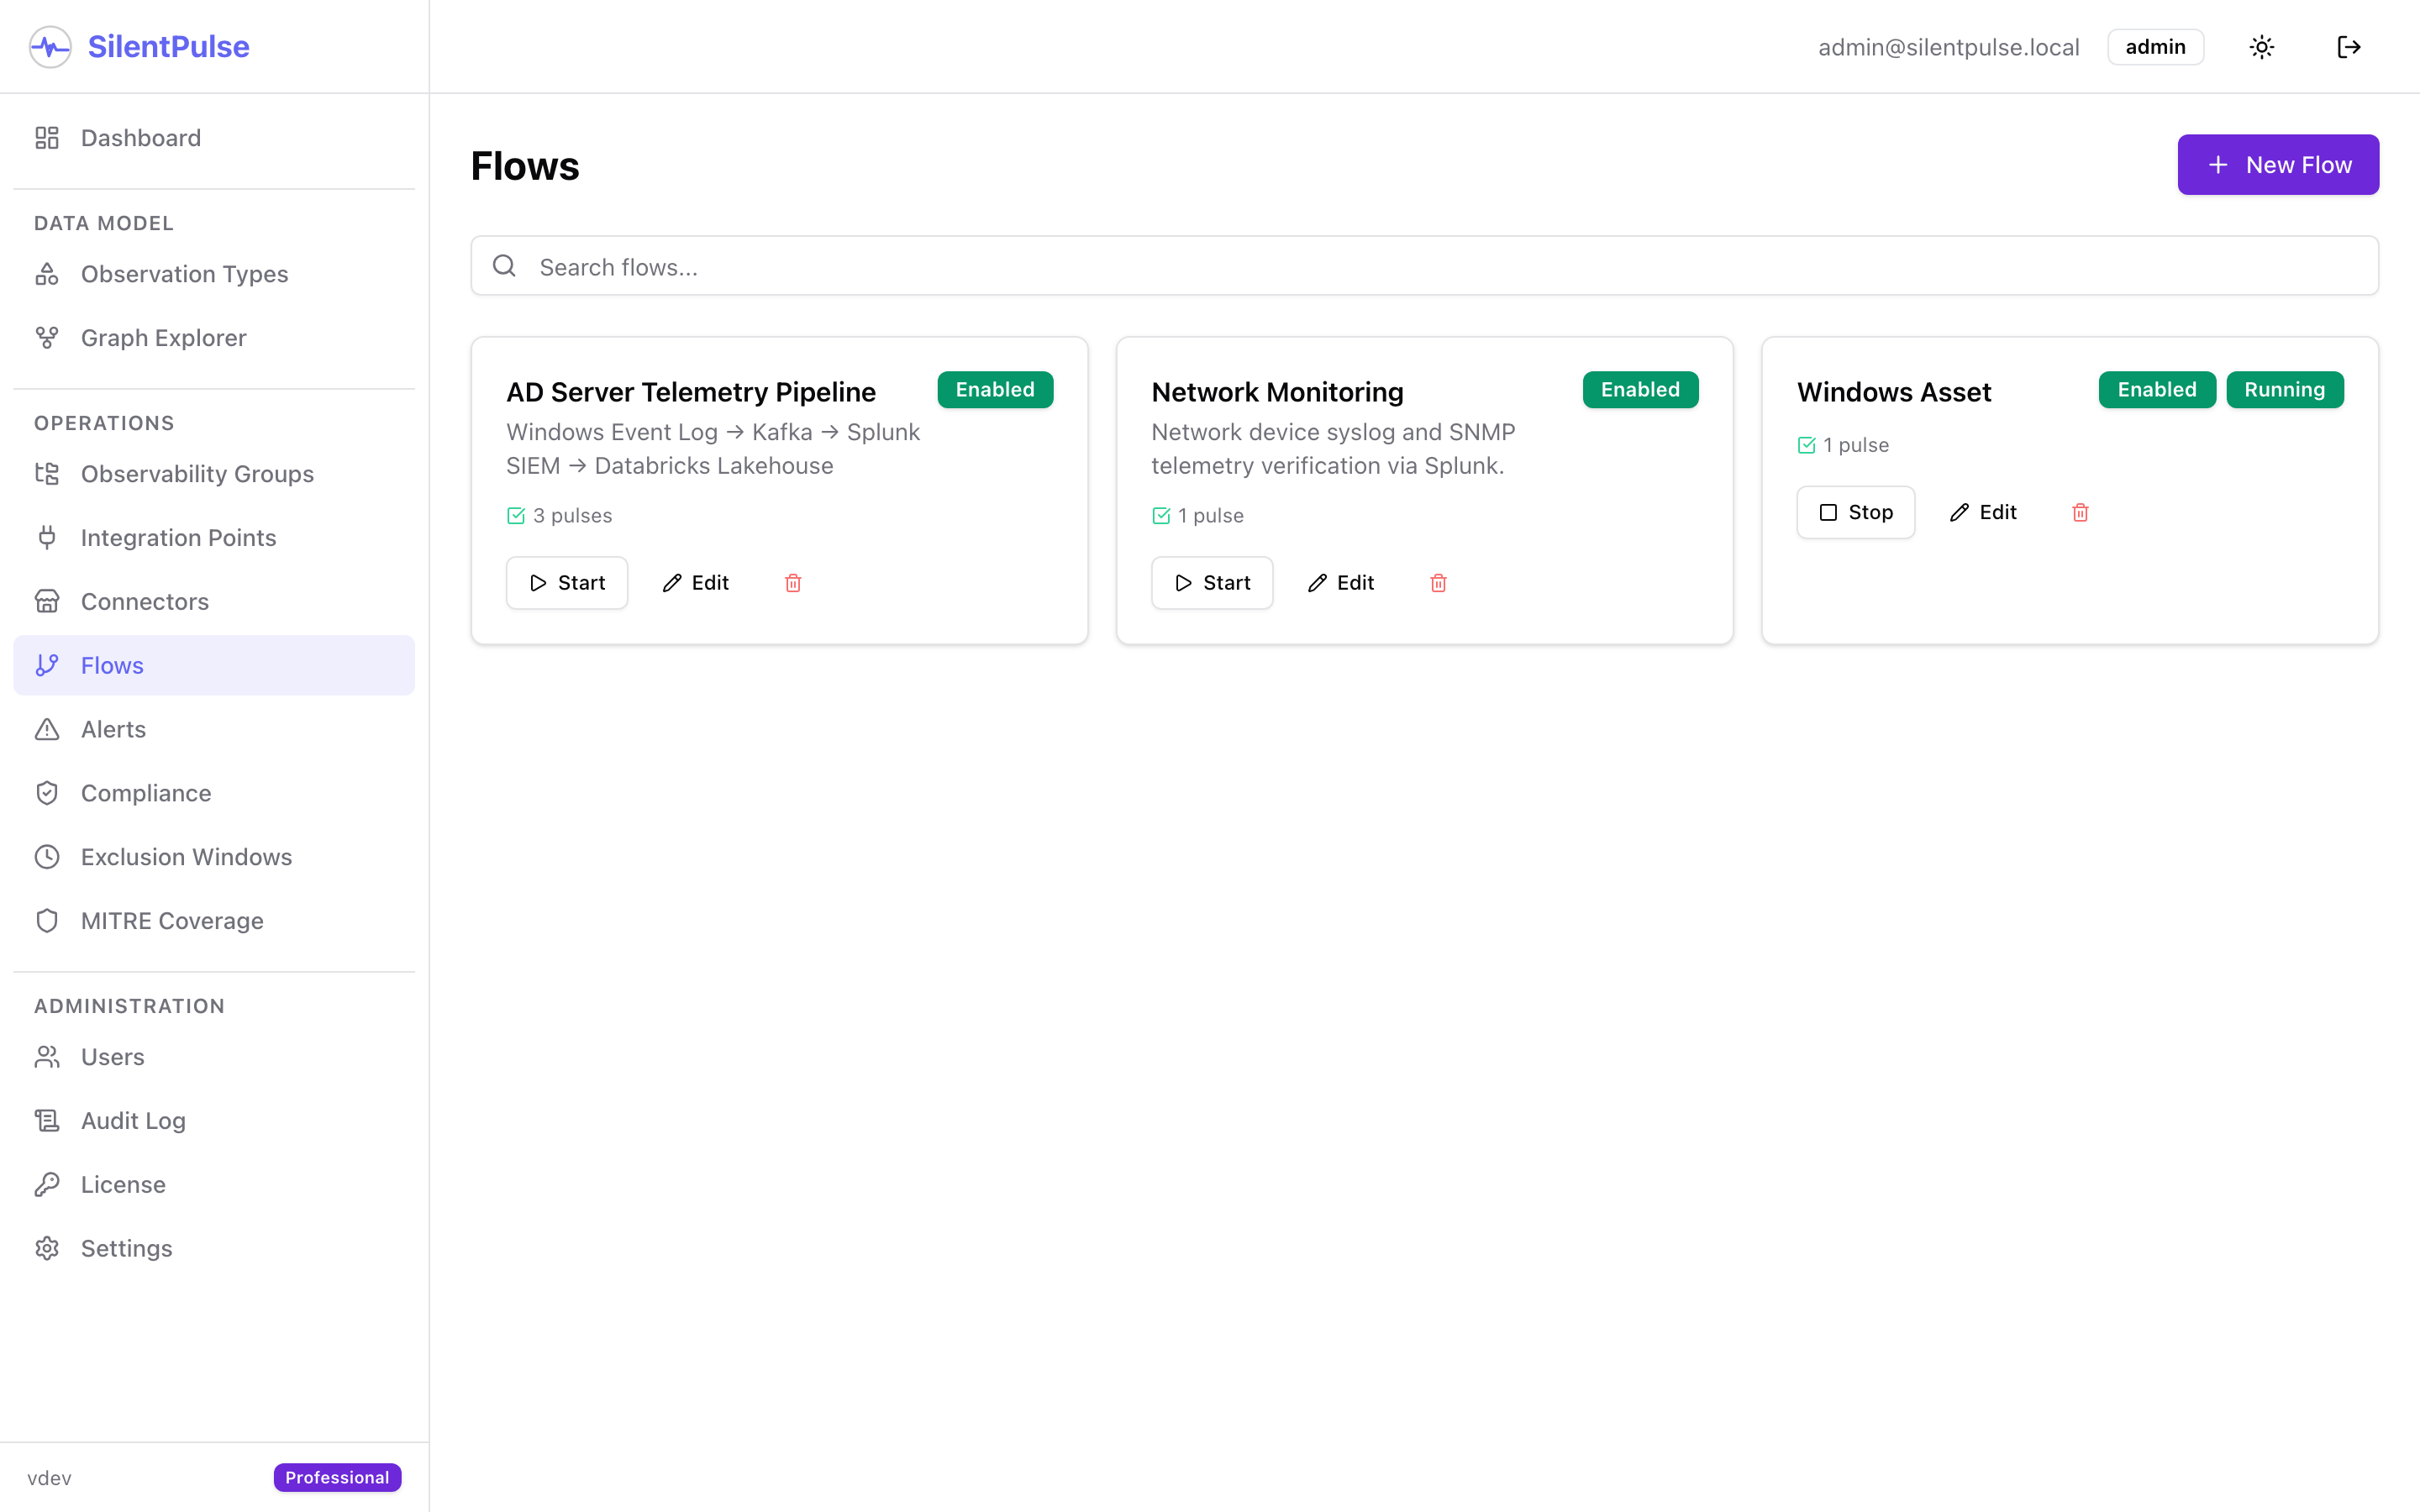
Each flow runs independently. SilentPulse’s scheduler executes the configured checks at the defined interval, compares the assets it expects to see (from the entity graph) against the assets it actually sees (from the connector query results), and generates alerts for any gaps.
Step 7: What happens when something goes silent
It’s Tuesday, 2:47 AM. A Windows update on three servers in the Application Servers OU causes the CrowdStrike sensor to crash. The servers are online. They respond to pings. Active Directory shows them as healthy.
At 2:57 AM, the next Kafka check runs. SilentPulse’s realtime pulse detects that SRV-APP-01, SRV-APP-02, and SRV-APP-03 have stopped producing events. Ten seconds later, the Splunk pulse confirms the gap. Thirty seconds after that, the Databricks pulse shows the same three servers missing from the lakehouse.
The scheduler compares expected vs. observed:
- Expected: 15 assets in the AD Production Servers group
- Observed: 12 assets across all three pipeline stages
- Gap: 3 assets, specifically
SRV-APP-01,SRV-APP-02,SRV-APP-03
SilentPulse opens three alerts. Each alert contains:
- Which asset went silent (hostname, IP, OU, last seen timestamp)
- How long it’s been silent (10 minutes and counting)
- Which pipeline stage detected the gap (Kafka, Splunk, Databricks, or all three)
- Which security functions are affected (Endpoint Security, Authentication, DNS, Network, Privilege Management)
- Which MITRE techniques lost coverage (23 techniques across 8 tactics)
- Which observability group is degraded (AD Production Servers: 100% down to 80% availability)
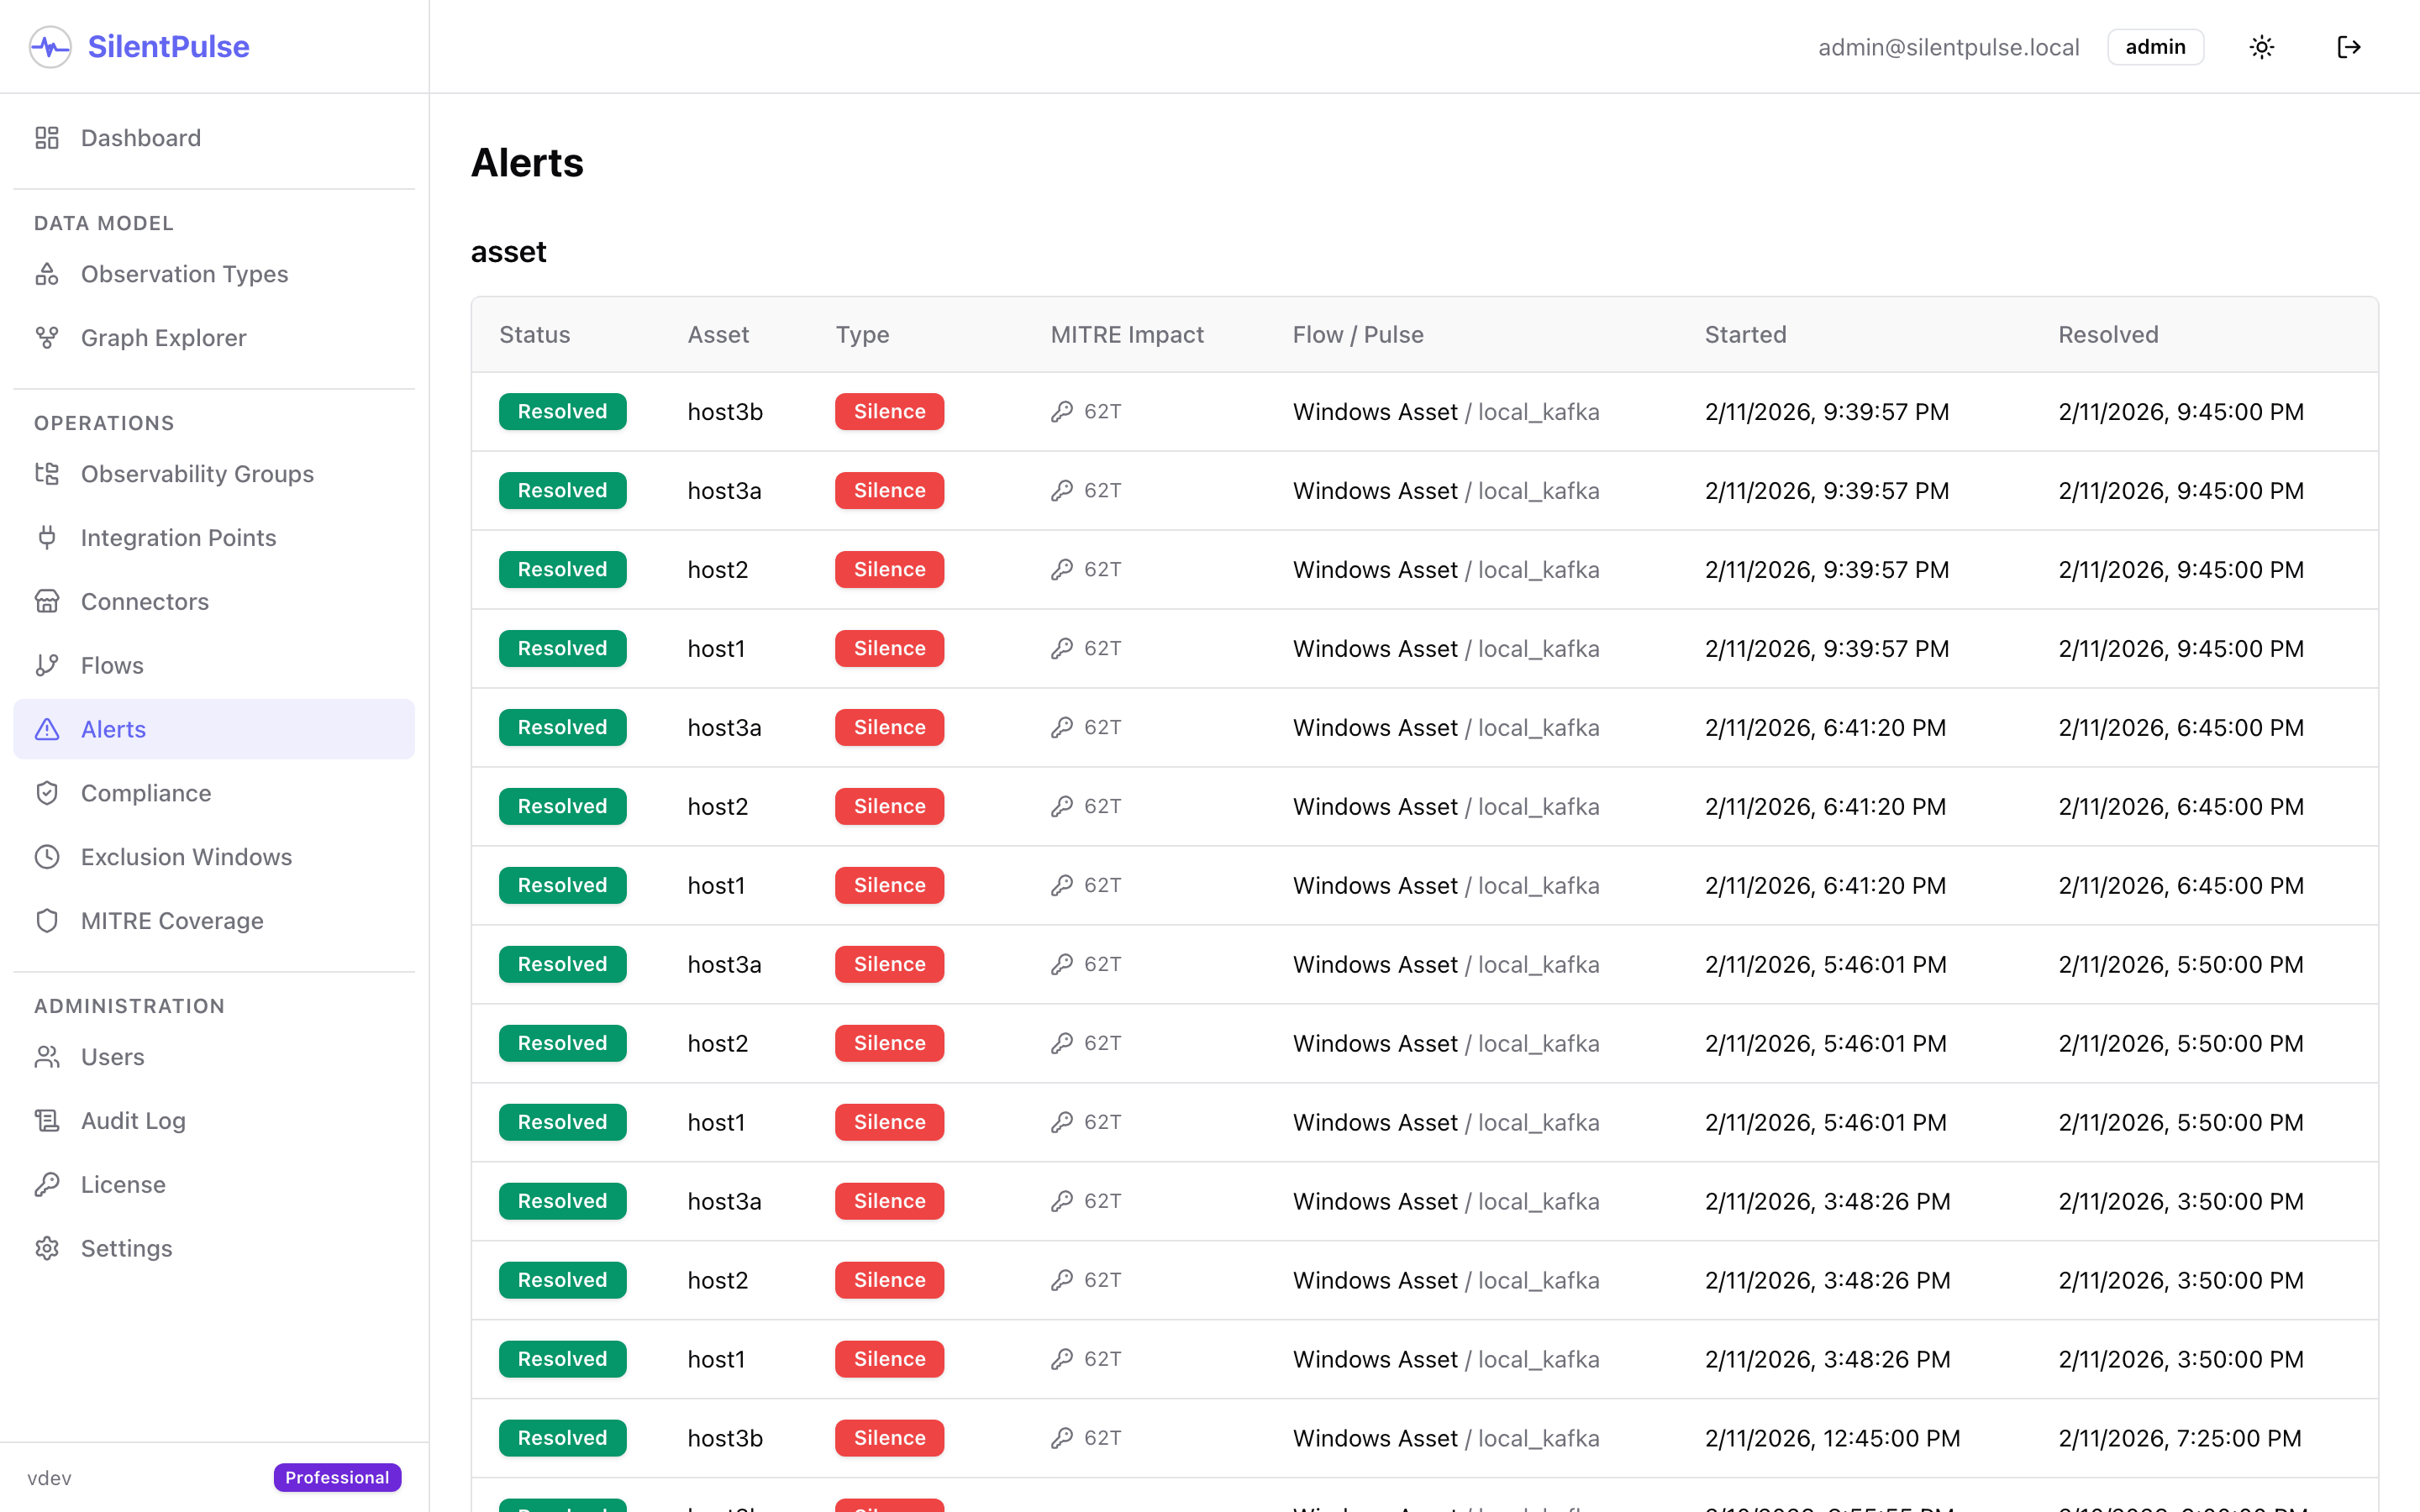
The on-call SOC analyst gets a Slack message from the “SOC Slack Alerts” channel. PagerDuty fires via the webhook. Sensors are restarted by 4:15 AM. Total blind time: 88 minutes.
Without SilentPulse? The average time to detect a telemetry gap through manual processes is measured in days to weeks. In the Equifax breach, an expired certificate went unnoticed for 19 months.
Step 8: Compliance tracking
Every check SilentPulse runs contributes to a continuous availability measurement. The Compliance dashboard shows, for each observability group:
- Current availability: percentage of assets producing telemetry right now
- Period availability: rolling daily/weekly/monthly average
- Target vs. actual: is this group meeting its SLA?
- Compliance breaches: timestamped records of every period where availability dropped below target, with root cause attribution
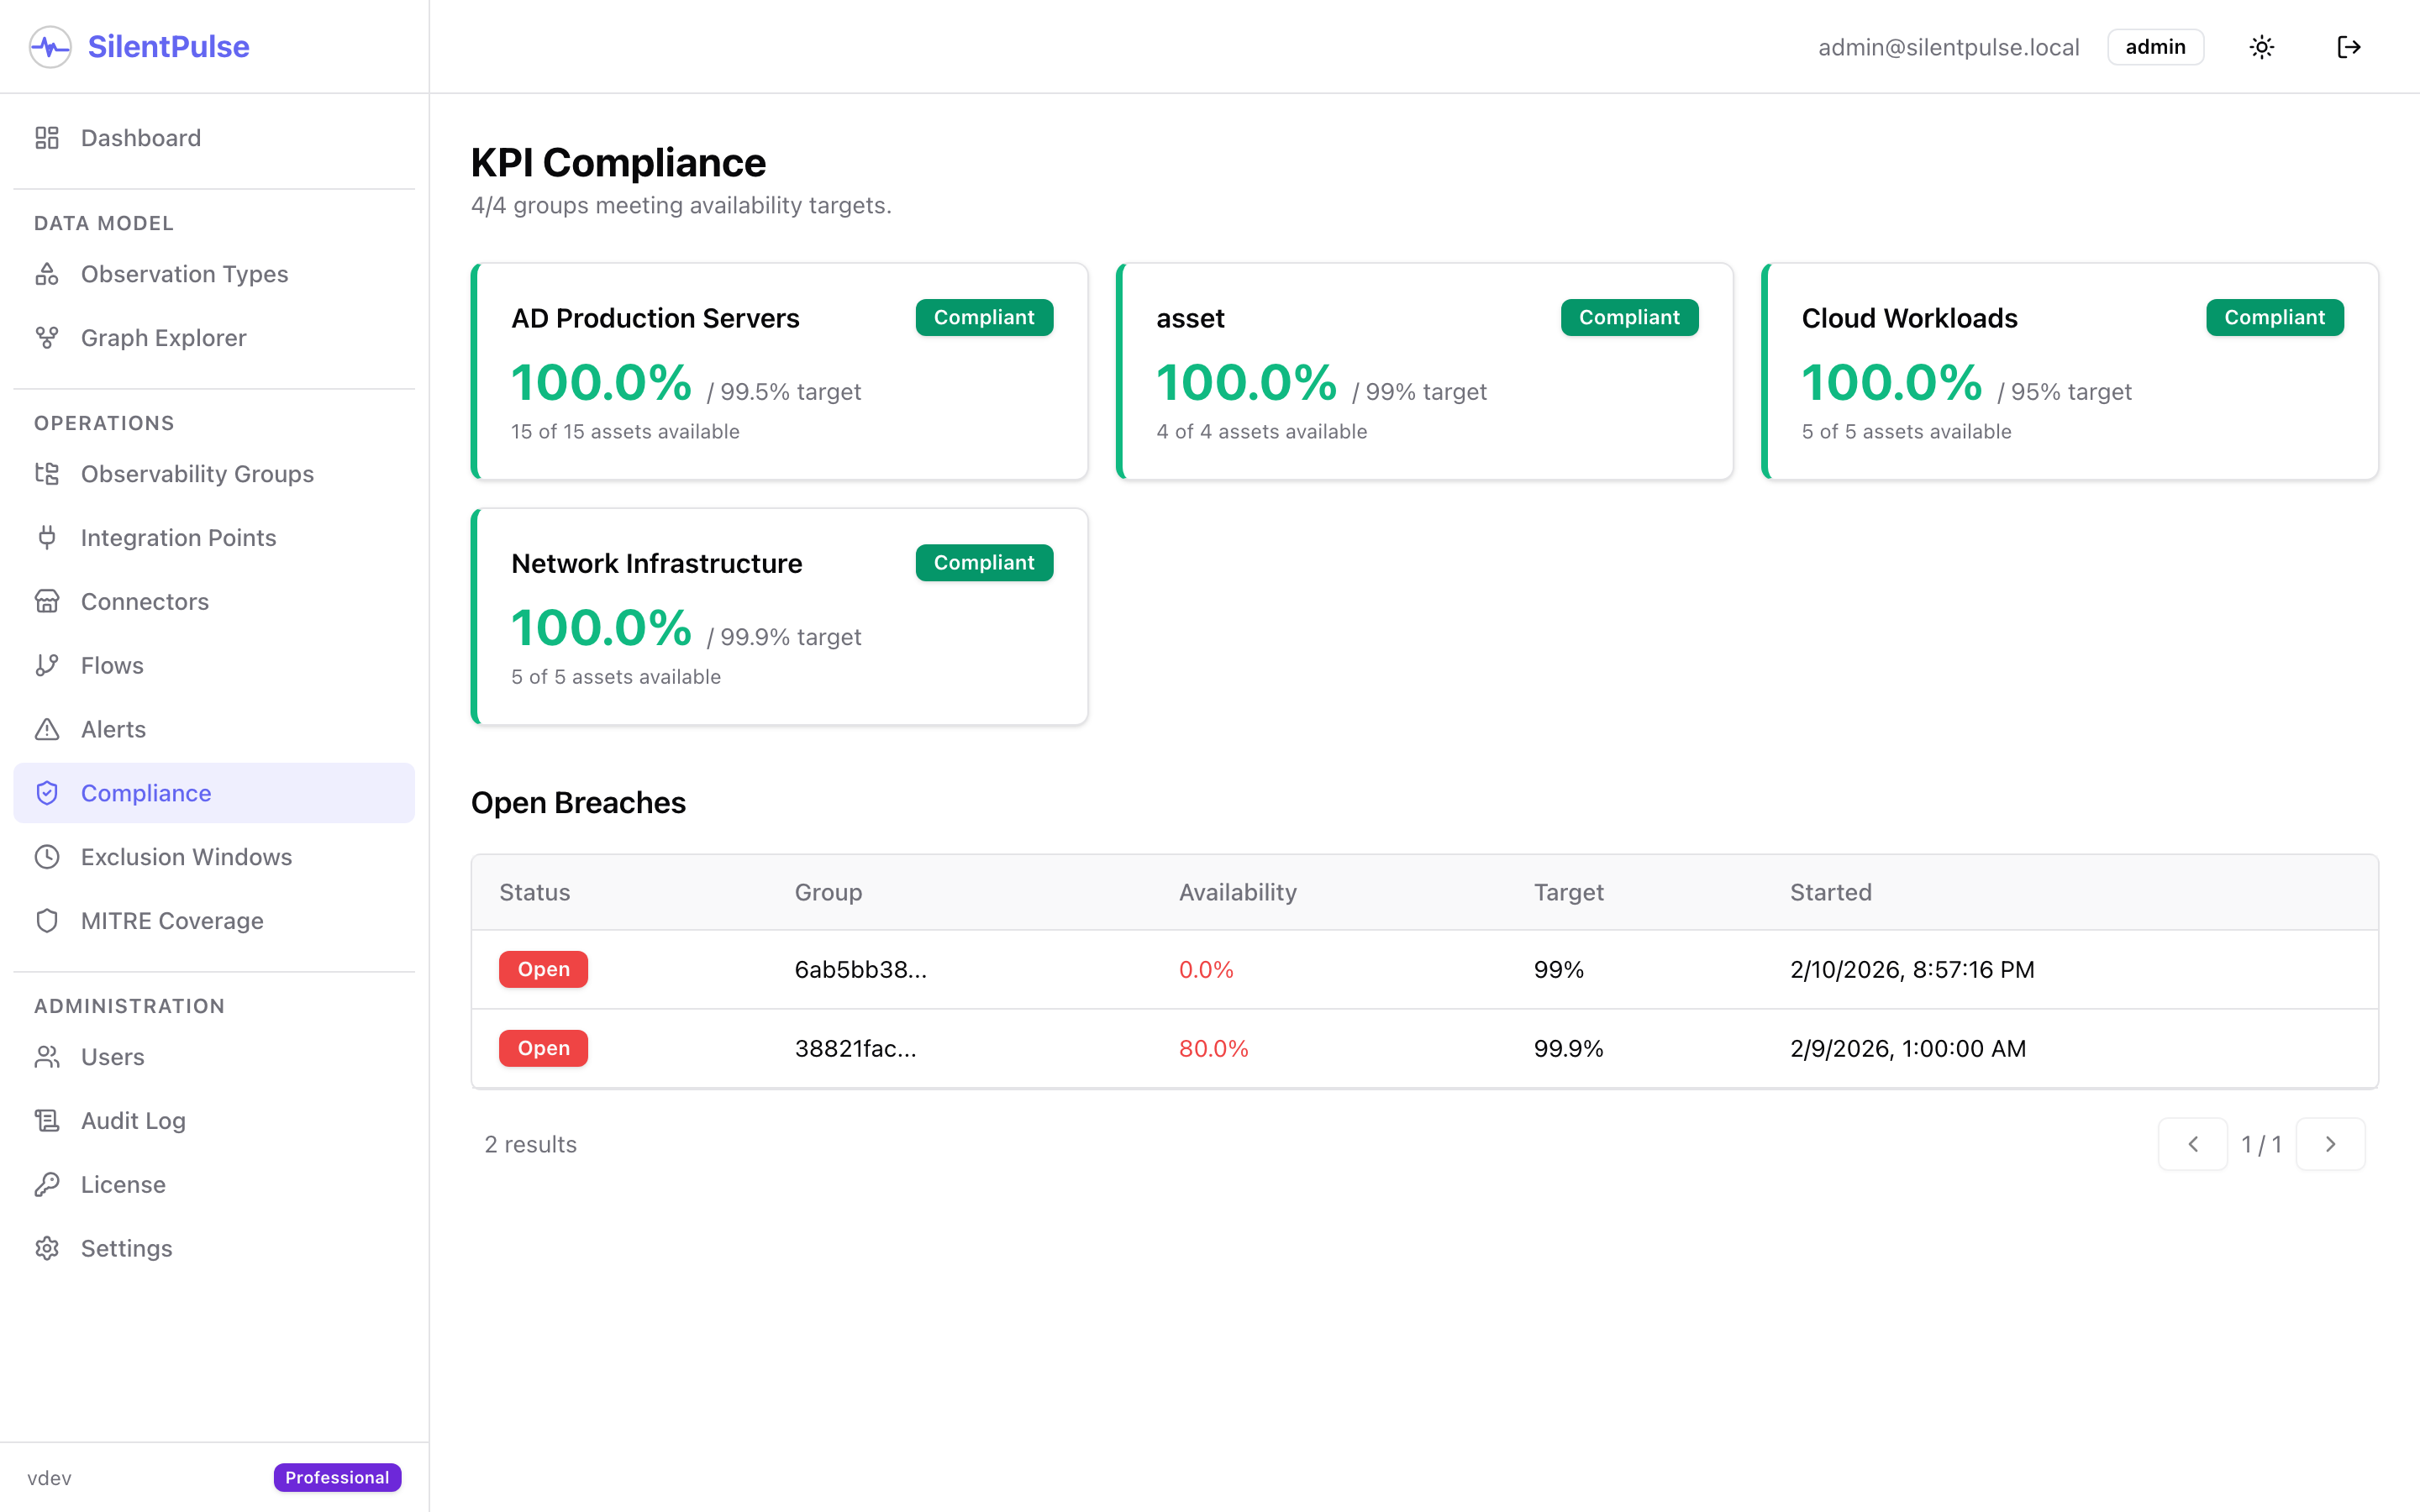
When your CISO asks “What was our AD server telemetry availability last quarter?”, you don’t pull spreadsheets and estimate. You pull up the dashboard and show them: 99.47% across AD Production Servers, with 1 compliance breach, resolved within 2 hours.
That kind of answer keeps auditors happy and boards confident.
Step 9: Exclusion windows
Real environments have planned maintenance. Patch windows that reboot entire segments. Network maintenance that disrupts syslog forwarding. Firmware upgrades on core switches.
SilentPulse handles this with exclusion windows, scheduled periods where specific groups are expected to be silent. No false alerts during maintenance. The moment the window closes, if telemetry hasn’t resumed, the alerts fire.
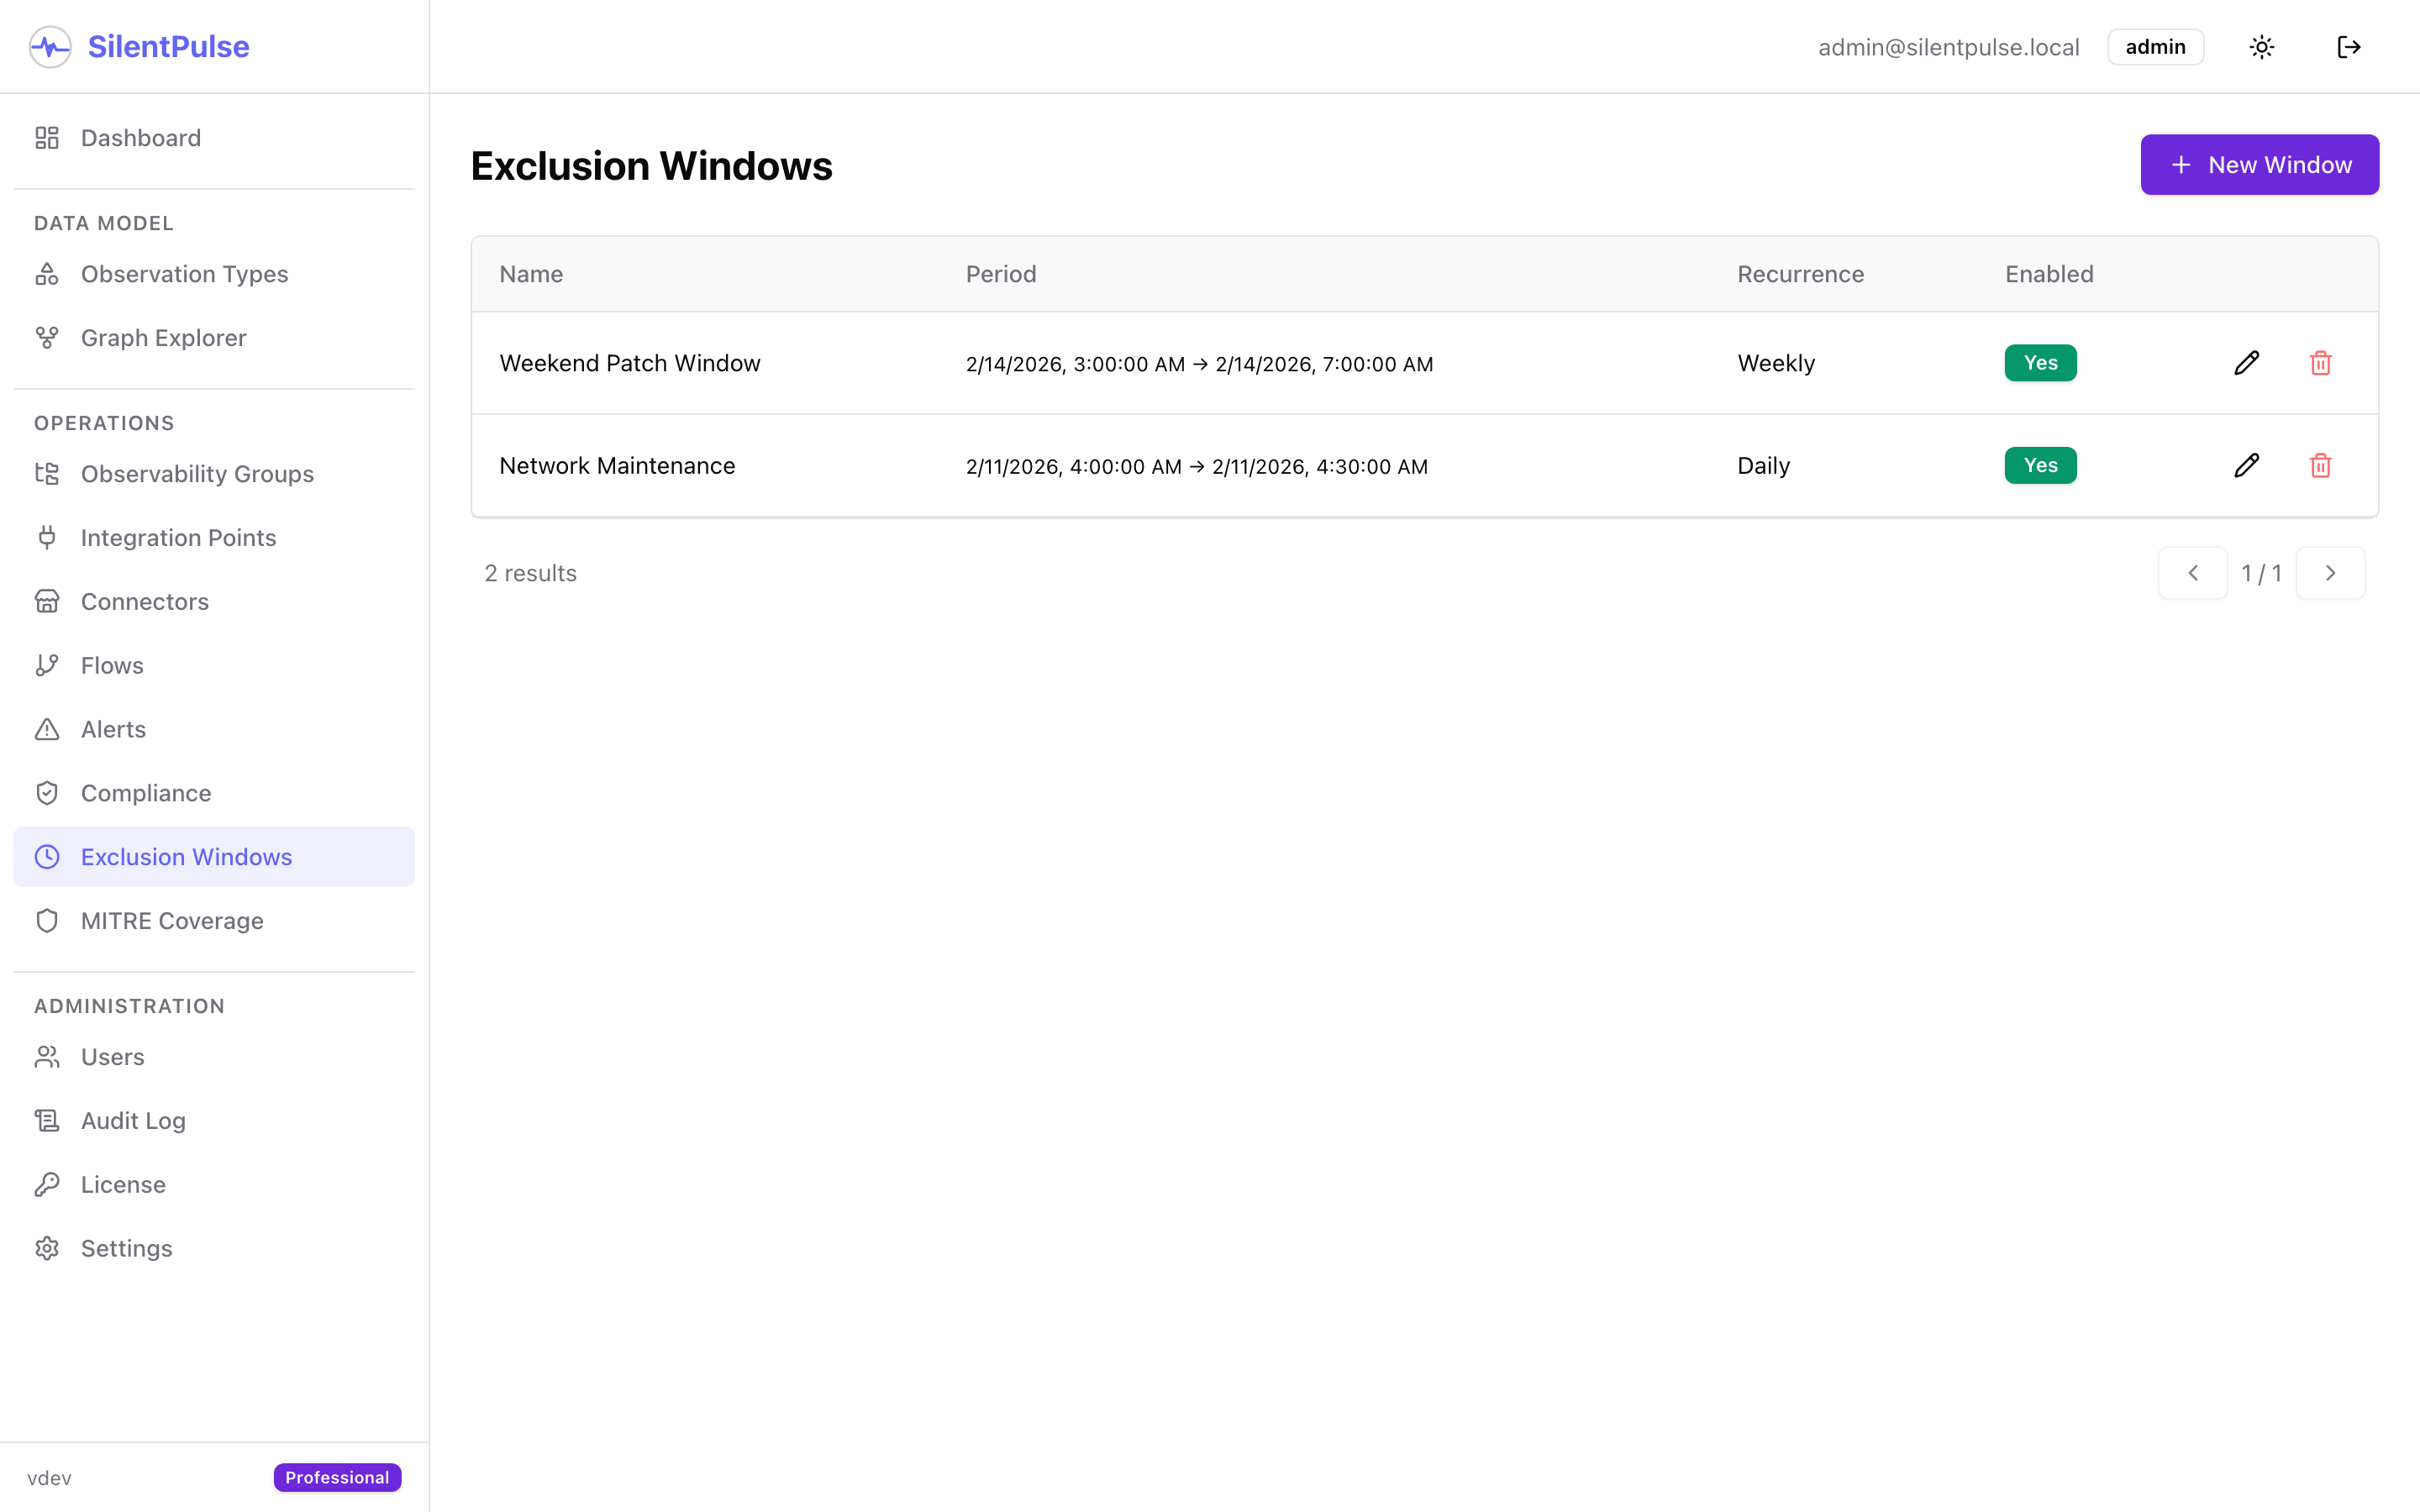
For our environment:
- Weekend Patch Window: AD Production Servers, every Saturday 02:00-06:00 UTC. Windows updates roll out, servers reboot, CrowdStrike sensors restart. SilentPulse stays quiet.
- Network Maintenance: Network Infrastructure, daily 03:00-03:30 UTC. Firmware sync on core switches. Expected brief syslog interruption.
The full picture
Zooming out, here is what we built:
Data flow: Active Directory into SilentPulse entity graph, then observability groups, security function mappings, 3 integration points (Kafka, Splunk, Databricks), monitoring flow with 3 pulses, alerts, MITRE impact, and compliance tracking.
What it answers:
- “Which assets should be producing telemetry?” The entity graph, synced from Active Directory.
- “Are they actually producing it, at every stage?” A 3-pulse pipeline, checking Kafka, Splunk, and Databricks independently.
- “What can we no longer detect?” Security function mappings linked to MITRE ATT&CK coverage.
- “Are we meeting our SLAs?” Compliance tracking against 99.5% daily availability.
- “What happened during the patch window?” Exclusion windows with automatic resume.
For an organization with an existing Active Directory and a Kafka/Splunk/Databricks pipeline, the entire setup, from first login to first monitored flow, takes less than an afternoon.
Try it yourself
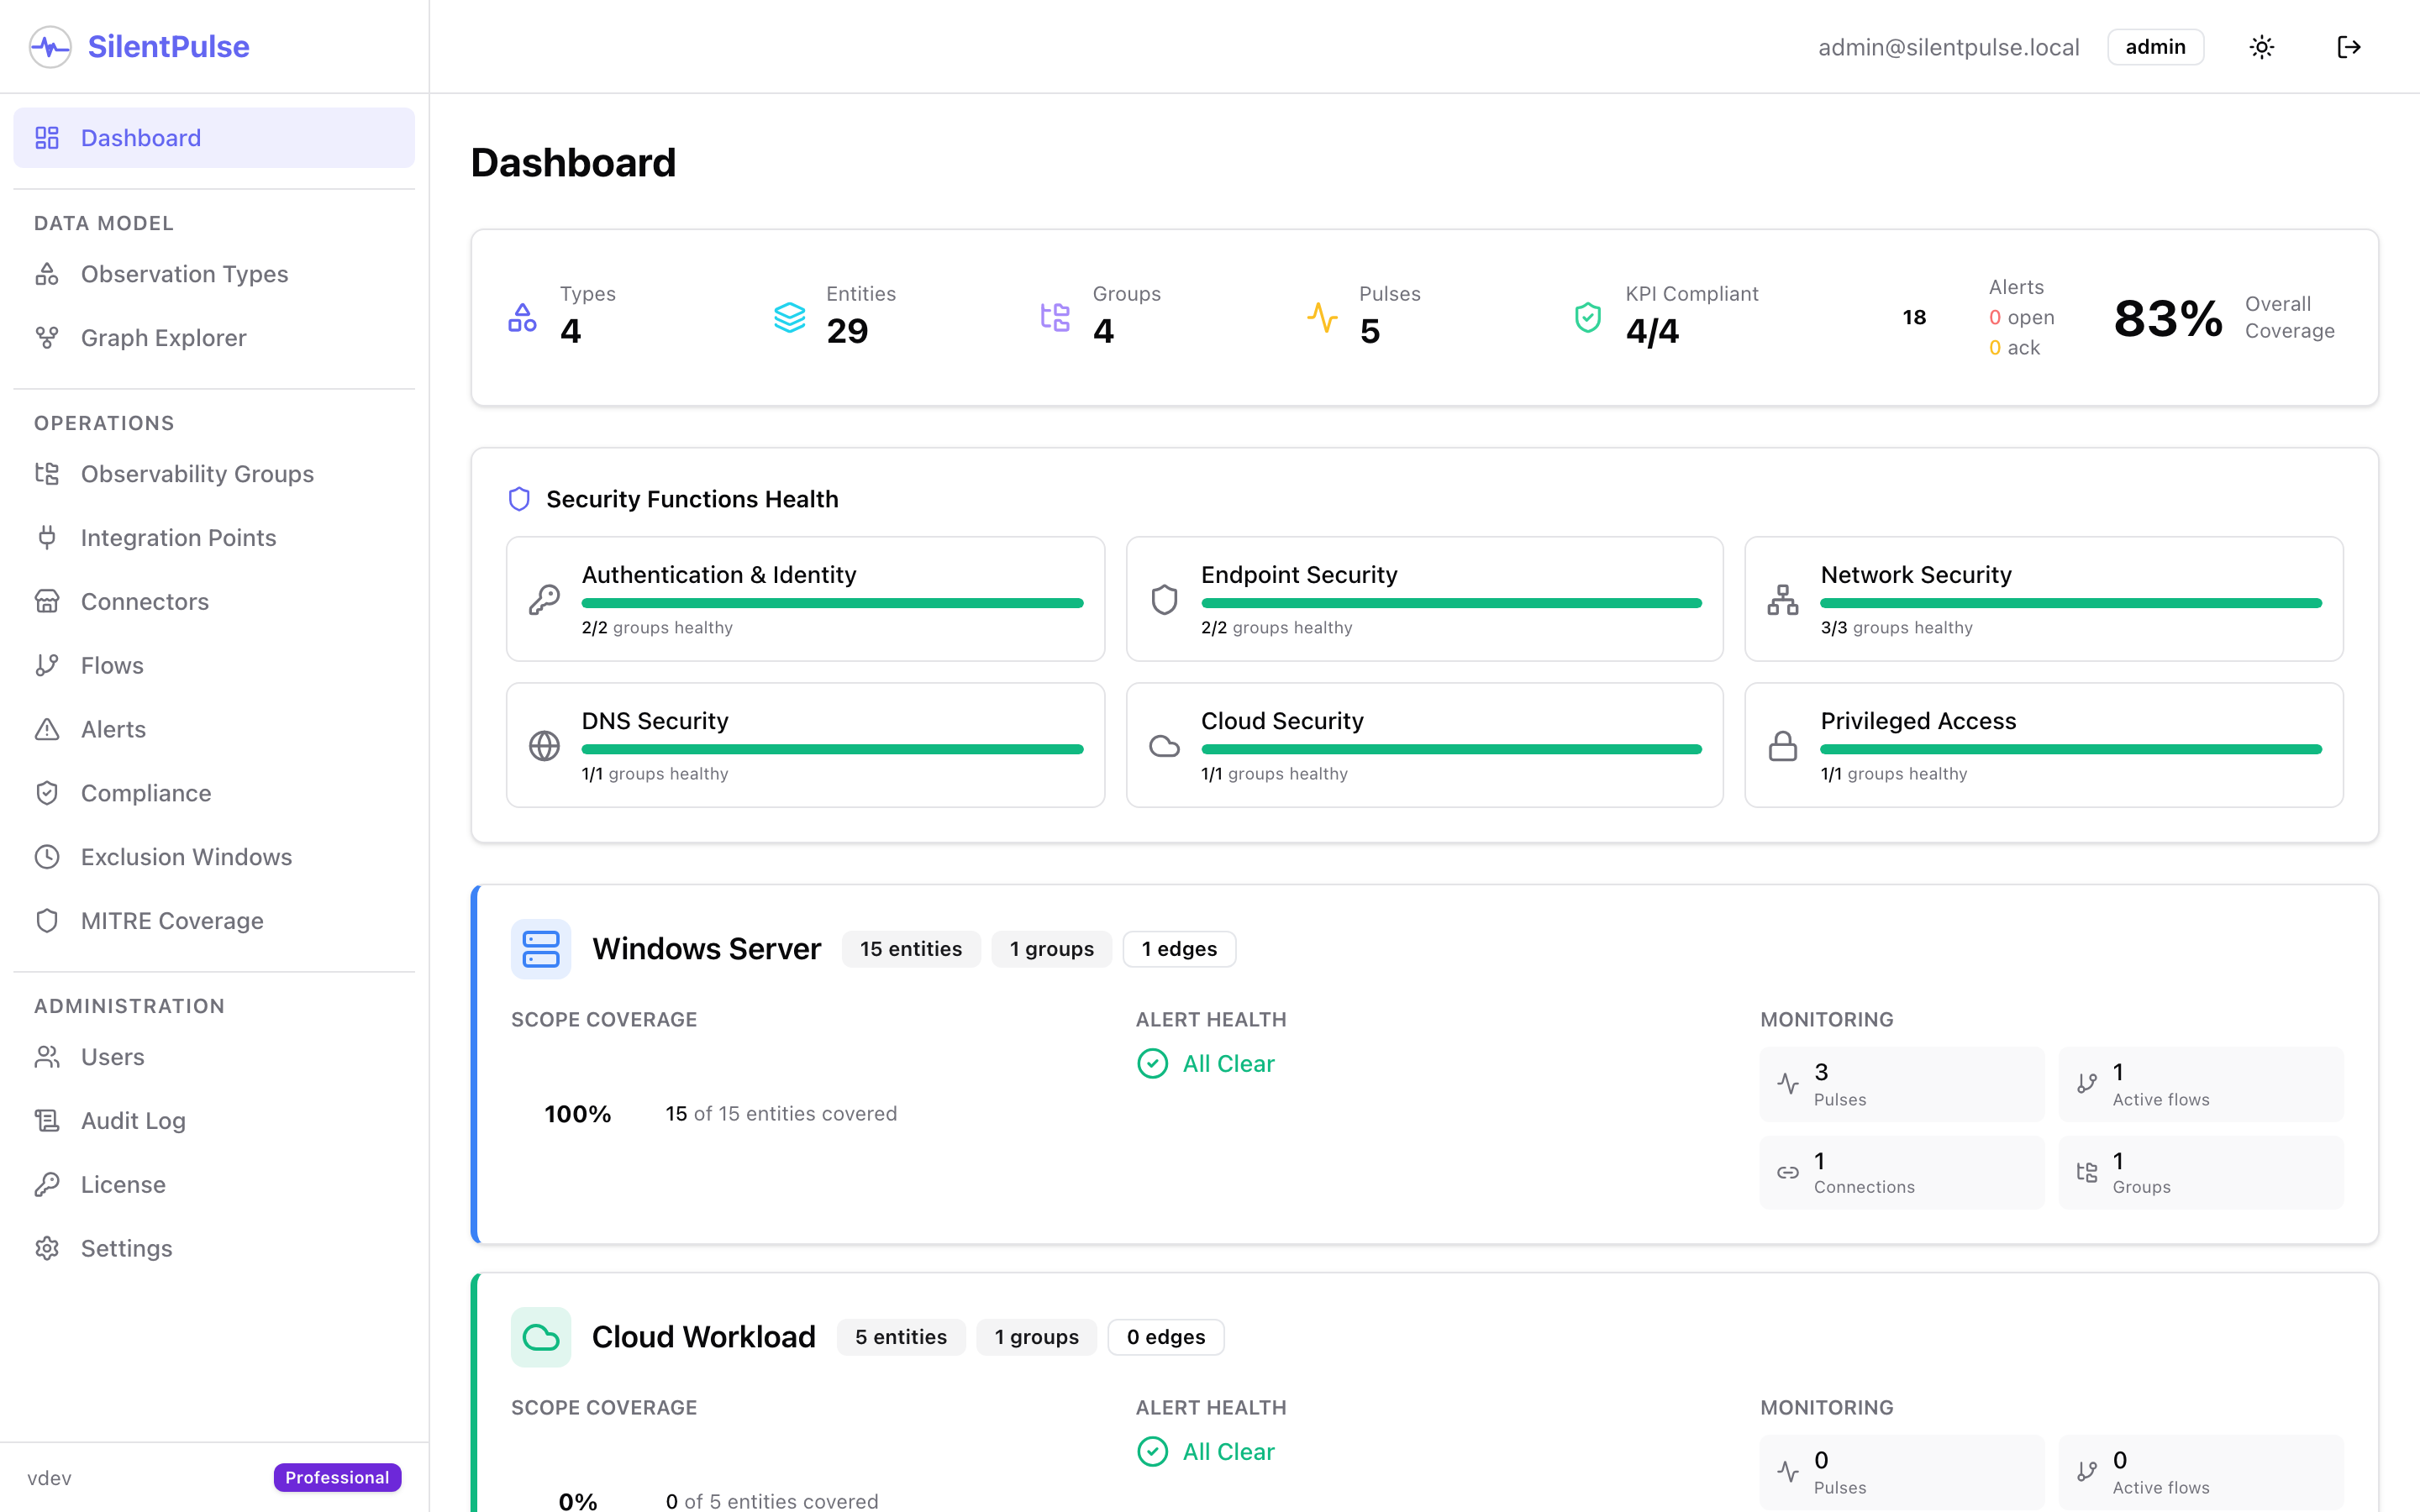
Everything described in this walkthrough runs in SilentPulse’s demo mode. Go to Settings, then Demo Mode, then Enable, and the system populates with sample data: three observation types (Windows Server, Network Device, Cloud Workload), 25 entities, three observability groups, a 3-pulse AD server pipeline with real connector types (Kafka, Splunk, Databricks), notification channels, exclusion windows, and compliance snapshots.
You can explore every screen, click every chart, and see exactly how the pieces fit together.
No credit card. No sales call. No “request access” form. Just the product.
Want to see SilentPulse in action?
We would love to walk you through a live demo tailored to your environment, covering your stack, your scale, and your blind spots. No slides, no fluff. Just the product.
Request a Demo