What if your Monday morning SOC check looked like this?
You: "Show me all open critical alerts."
AI:  "No open critical alerts, system is clean."

You: "What monitoring pipelines do I have?"
AI:  "3 flows active: AD Server Telemetry (3-stage),
      Network Monitoring, Windows Asset. All enabled."

You: "If the AD telemetry pipeline goes down,
      what MITRE techniques do I lose coverage for?"
AI:  "478 techniques across 14 tactics. Credential Access
      alone: OS Credential Dumping, LSASS Memory, Kerberoasting..."
No dashboards. No tab switching. No clicking through five pages to build context. Just a conversation with your security monitoring platform, from the tool you already work in.
That is what SilentPulse’s built-in MCP server does.
What is MCP?
Model Context Protocol is an open standard introduced by Anthropic that lets AI assistants connect to external data sources through a uniform interface. It works like a universal adapter: one protocol, any tool.
An MCP server exposes tools (actions the AI can call) and resources (data the AI can read). An MCP client, whether Claude Code, Cursor, Windsurf, or another compatible IDE, discovers those tools automatically and uses them to answer your questions.
The AI does not need to know your database schema. The MCP server handles the query, returns structured data, and the AI interprets it in context.
SilentPulse’s MCP server
SilentPulse ships with a standalone MCP server binary. It connects directly to your PostgreSQL database and exposes your security visibility data through 8 purpose-built tools:
| Tool | What it does |
|---|---|
search_alerts | Find alerts by status, severity, type, or asset group |
get_alert_stats | Aggregated counts: open, acknowledged, resolved |
list_flows | All monitoring pipelines with enabled/disabled status |
list_observation_types | Asset types (servers, network devices, cloud workloads) |
search_entities | Find specific assets by ID or type |
get_entities_with_status | Assets enriched with monitoring status and alert counts |
get_mitre_coverage | Organization-wide MITRE ATT&CK coverage summary |
check_asset_group_mitre_impact | Which techniques are at risk if a group loses telemetry |
Two transport modes: stdio (for local CLI tools like Claude Code) and HTTP/SSE (for remote or web-based clients). Configuration is three environment variables: POSTGRES_DSN, MCP_TENANT_ID, and MCP_TRANSPORT.
Setup: three lines in a JSON file
To connect Claude Code to your SilentPulse instance, create a .mcp.json in your project root:
{
  "mcpServers": {
    "silentpulse": {
      "type": "http",
      "url": "http://silentpulse.local/mcp"
    }
  }
}
Claude Code discovers the server, enumerates the tools, and makes them available in conversation. No SDK. No plugin installation. No API key exchange beyond what you have already configured.
For stdio mode (local binary), the config points to the executable instead:
{
  "mcpServers": {
    "silentpulse": {
      "command": "./silentpulse-mcp",
      "args": [],
      "env": {
        "POSTGRES_DSN": "postgres://user:pass@localhost:5432/silentpulse",
        "MCP_TENANT_ID": "your-tenant-uuid"
      }
    }
  }
}
Production: API key authentication
For production deployments, pass a SilentPulse API key via the Authorization header. The key is scoped to a specific tenant and respects the same RBAC permissions as the web UI. A read-only analyst key can query alerts and assets, but cannot acknowledge or resolve them.
{
  "mcpServers": {
    "silentpulse": {
      "type": "http",
      "url": "https://silentpulse.company.com/mcp",
      "headers": {
        "Authorization": "Bearer spk_live_7f3a...your-api-key"
      }
    }
  }
}
The API key inherits the tenant context, so no MCP_TENANT_ID is needed. The server resolves tenant identity from the key itself.
Enterprise: OAuth2 + mTLS
For organizations that require identity-aware access and zero-trust networking, SilentPulse supports OAuth2 client credentials flow with optional mutual TLS. The MCP server validates the access token against your IdP (Okta, Entra ID, Keycloak), extracts tenant and role claims from the JWT, and enforces per-tool authorization.
{
  "mcpServers": {
    "silentpulse": {
      "type": "http",
      "url": "https://silentpulse.company.com/mcp",
      "oauth": {
        "client_id": "mcp-soc-analyst",
        "client_secret_env": "SP_OAUTH_SECRET",
        "token_url": "https://login.company.com/oauth2/token",
        "scopes": ["silentpulse:read", "silentpulse:alerts:write"]
      },
      "tls": {
        "cert": "~/.silentpulse/client.crt",
        "key": "~/.silentpulse/client.key",
        "ca": "~/.silentpulse/ca.crt"
      }
    }
  }
}
With this setup:
- Authentication uses OAuth2 client credentials flow. The MCP client obtains and refreshes tokens automatically. No passwords, no static keys.
- Authorization maps JWT claims to SilentPulse RBAC roles. The
silentpulse:readscope grants access to query tools. Thesilentpulse:alerts:writescope unlocks acknowledge/resolve operations. A SOC analyst gets read + write. A CISO dashboard gets read-only. - Transport security relies on mutual TLS so both sides verify identity at the connection level. The MCP server rejects connections without a valid client certificate, even if the OAuth token is correct. Defense in depth.
- Audit trail captures every MCP tool call with the authenticated identity, source IP, and timestamp, the same audit log as the web UI and REST API.
This means your AI assistant has the same access controls, the same audit trail, and the same tenant isolation as any other client in your security stack. No backdoors. No privilege escalation. Just another authenticated consumer of your security visibility data.
The demo: Monday morning visibility check
A realistic scenario. Monday morning. You are a SOC analyst who wants to verify that nothing broke over the weekend. Instead of opening four dashboards, you open your terminal.
Step 1: “Did anything break?”
You ask: “Show me alert statistics.”
The AI calls get_alert_stats and returns:
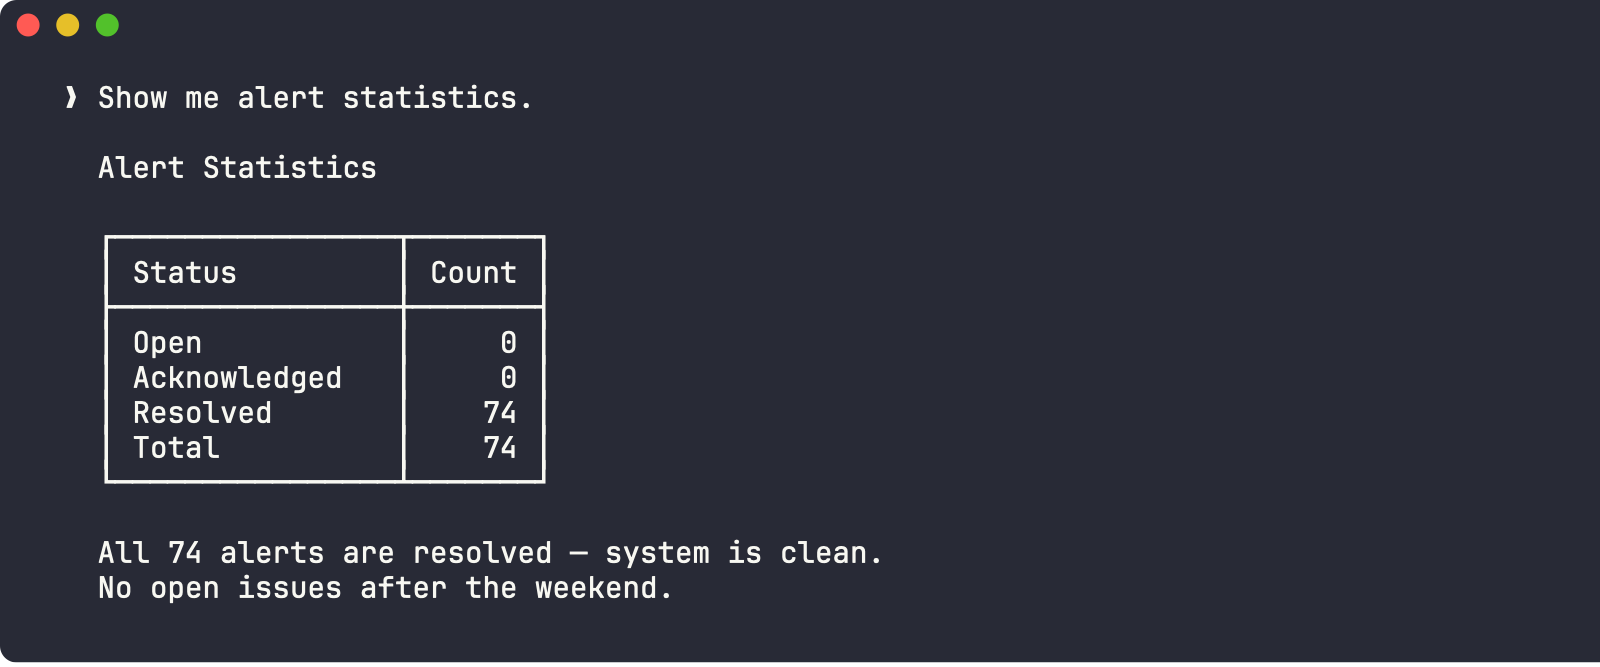
All 74 alerts were resolved automatically, brief telemetry gaps that self-healed. Zero open issues. A one-second answer to a question that would normally require navigating to the alerts dashboard, applying filters, and reading a table.
Step 2: “Are my pipelines running?”
You ask: “List all monitoring flows and their status.”
The AI calls list_flows:
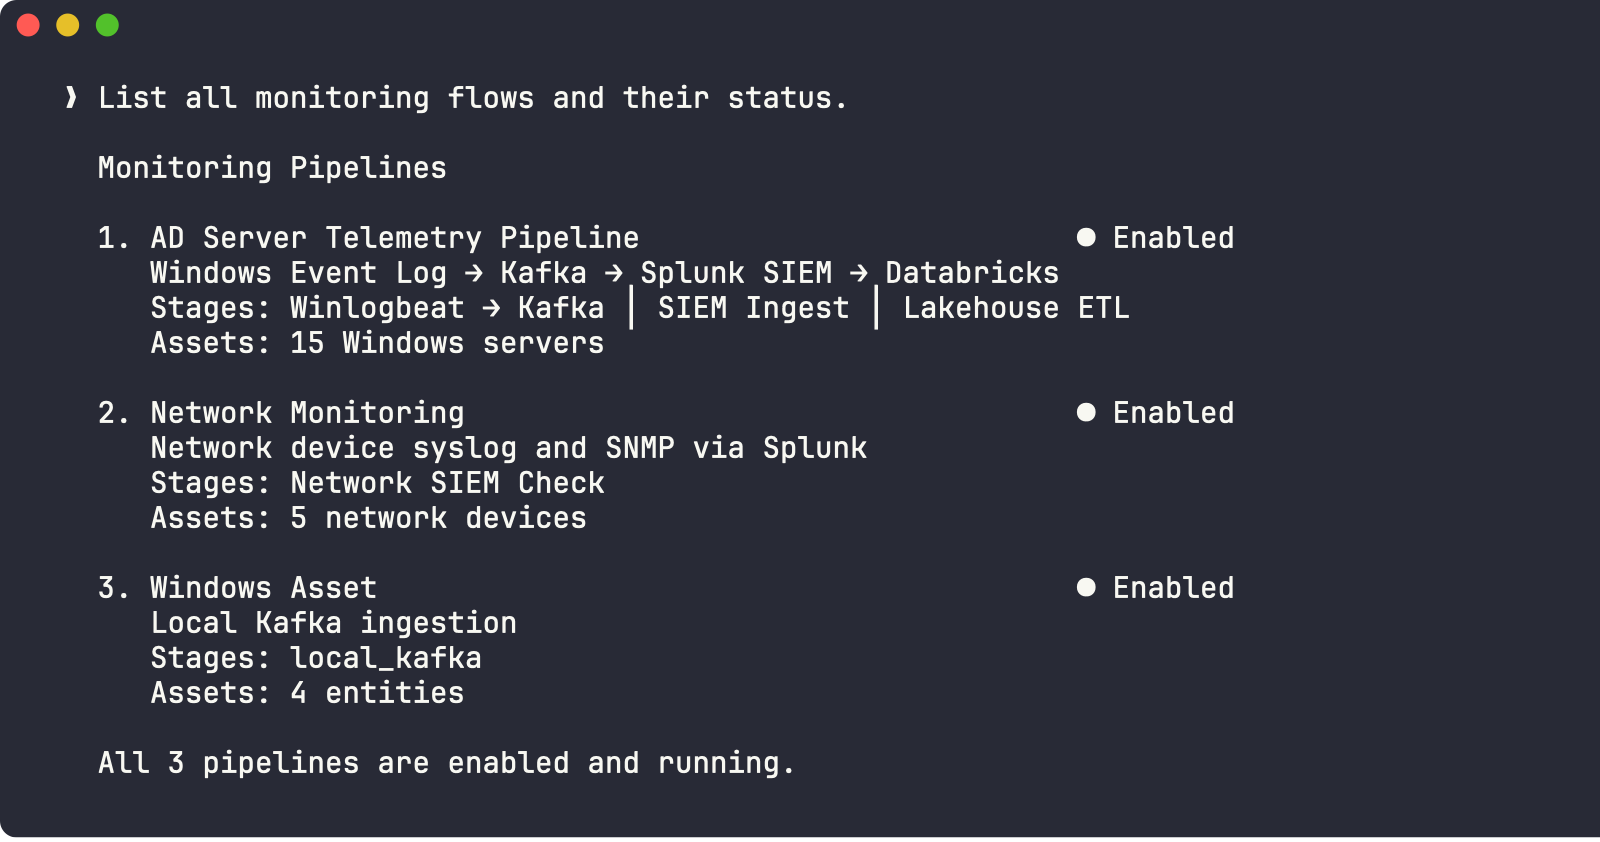
Three pipelines, all enabled. The AD Server pipeline is the most complex: a 3-stage flow tracking telemetry from Windows Event Logs through Kafka, into Splunk SIEM, and finally to a Databricks lakehouse. Each stage is independently monitored.
Step 3: “What am I monitoring?”
You ask: “How many assets do I have, broken down by type?”
The AI calls list_observation_types:
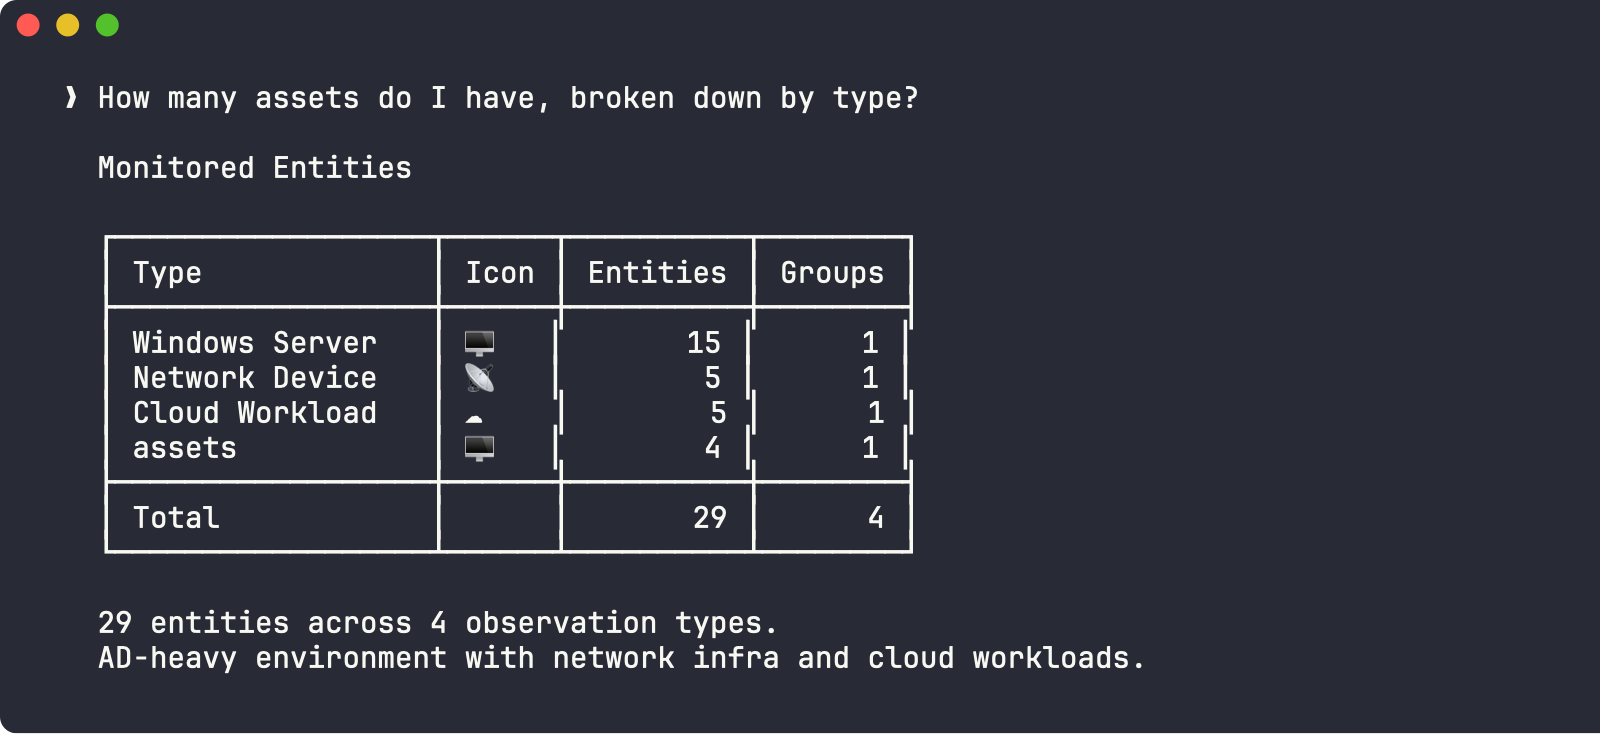
29 monitored entities across 4 types. You immediately see the shape of your environment: AD-heavy, with network infrastructure and cloud workloads.
Step 4: “Show me the firewalls”
You ask: “Show me all network devices.”
The AI calls get_entities_with_status filtered by the Network Device observation type:
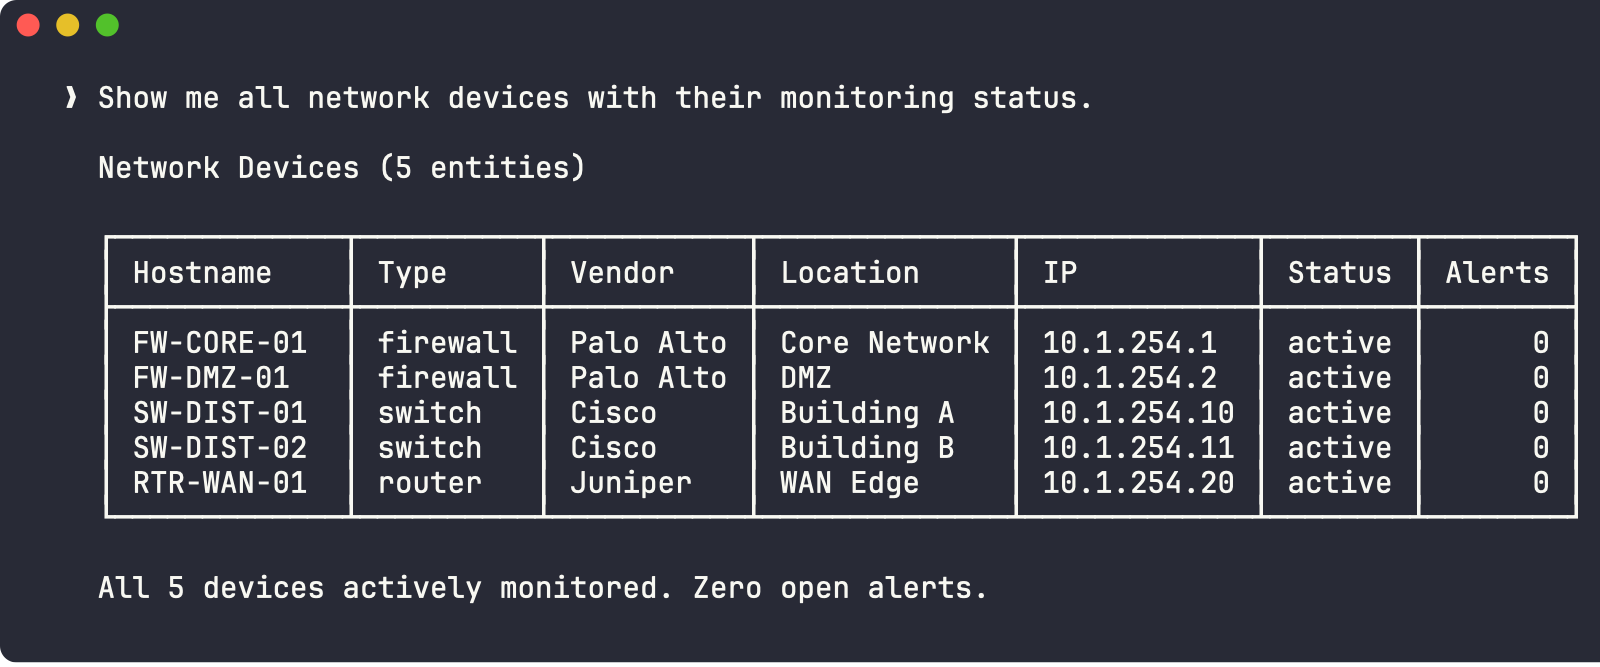
All five network devices are actively monitored with zero open alerts. You can see the vendor mix (Palo Alto firewalls, Cisco switches, Juniper router), the network segmentation (Core, DMZ, Buildings, WAN), and the monitoring status, all from a single question.
Step 5: “What’s the blast radius?”
Beyond checking status, you can assess risk directly.
You ask: “If the AD Server Telemetry Pipeline goes down, what MITRE ATT&CK techniques do I lose coverage for?”
The AI calls check_asset_group_mitre_impact for the AD server group:
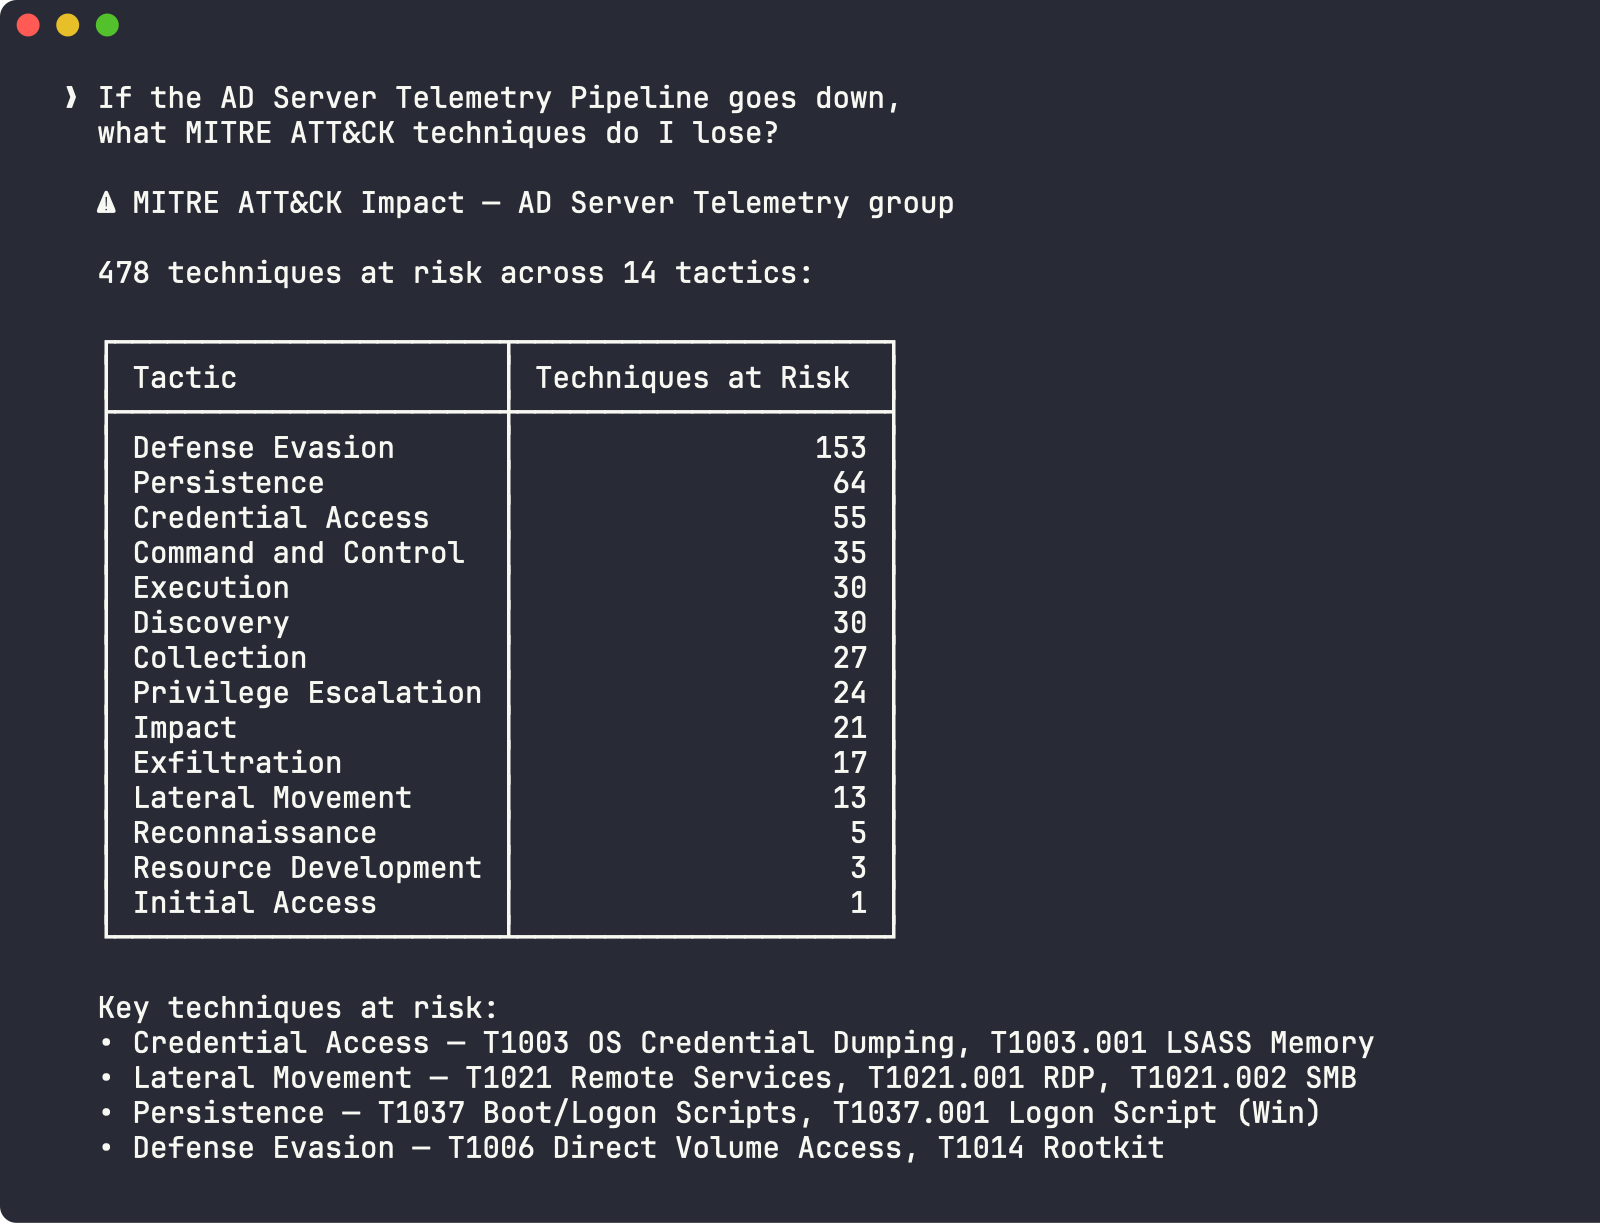
It does not stop at counts. The AI shows you specific techniques:
Credential Access - T1003: OS Credential Dumping, T1003.001: LSASS Memory, T1003.002: Security Account Manager
Lateral Movement - T1021: Remote Services, T1021.001: Remote Desktop Protocol, T1021.002: SMB/Windows Admin Shares
Defense Evasion - T1006: Direct Volume Access, T1014: Rootkit, T1027: Obfuscated Files or Information
Persistence - T1037: Boot or Logon Initialization Scripts, T1037.001: Logon Script (Windows)
This kind of context normally requires cross-referencing three different tools: your monitoring platform, your detection coverage matrix, and the MITRE ATT&CK framework. MCP collapses it into a single conversational turn.
Step 6: “What happened over the weekend?”
You ask: “Show me the resolved alerts, what went wrong?”
The AI calls search_alerts with status=resolved:
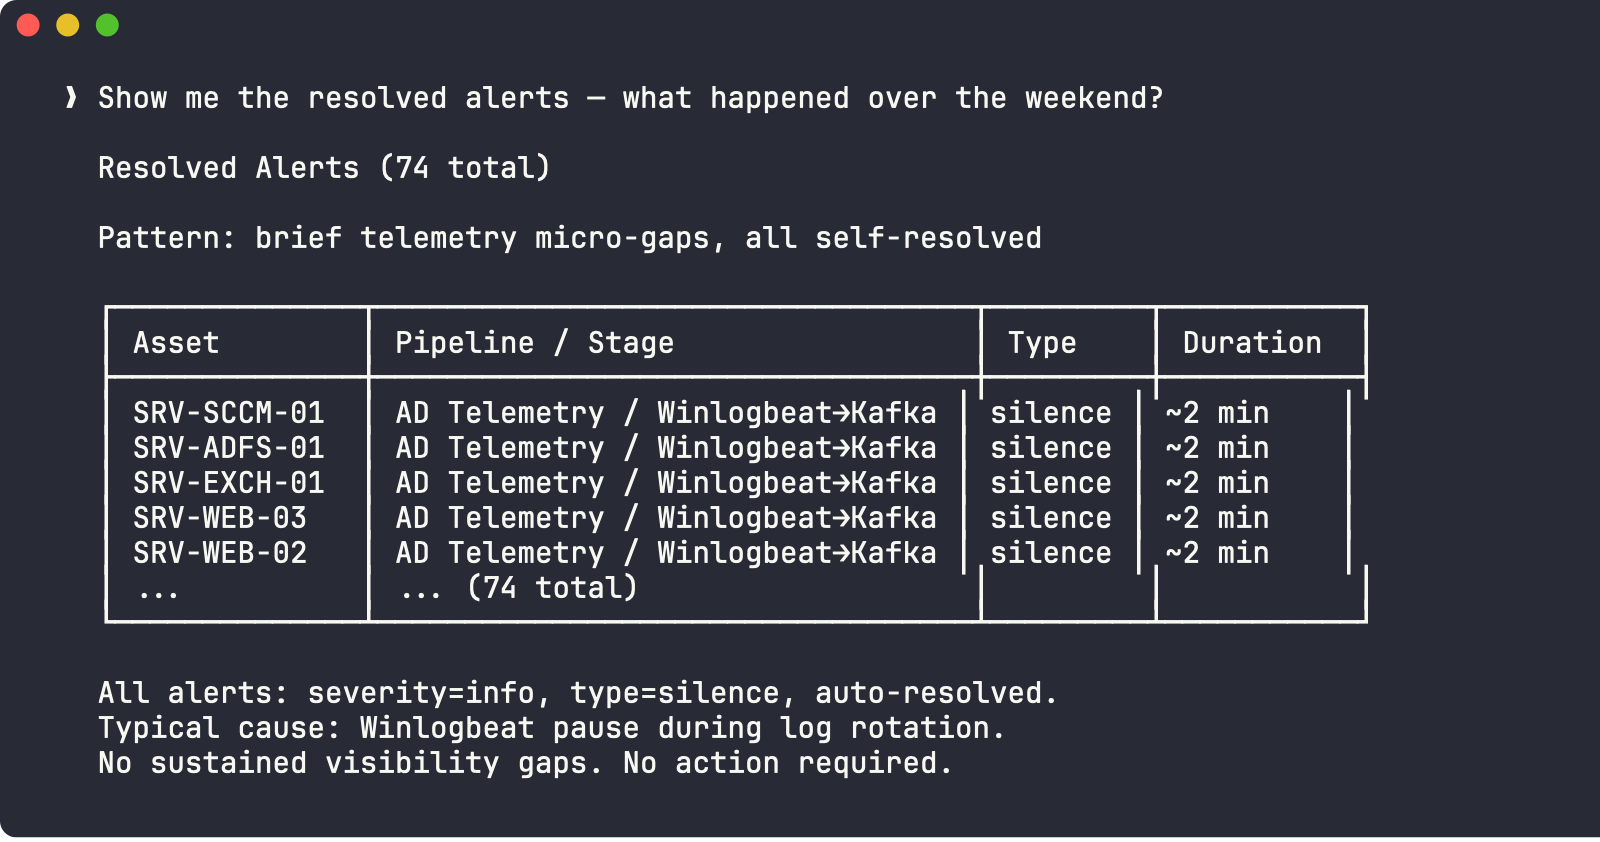
All 74 resolved alerts share a pattern:
- Type: silence (telemetry stopped arriving)
- Severity: info (brief, self-resolving)
- Pipeline: AD Server Telemetry Pipeline, Winlogbeat to Kafka stage
- Duration: ~2 minutes each (e.g., 22:18 to 22:20)
- Assets affected: SRV-SCCM-01, SRV-ADFS-01, SRV-EXCH-01, SRV-WEB-02, SRV-WEB-03, and others
These were micro-gaps, brief moments when Winlogbeat agents paused during log rotation or network blips. SilentPulse detected each one, classified it, and auto-resolved when telemetry resumed. The AI’s interpretation: “Normal operational noise. No sustained visibility gaps. No action required.”
What this changes
For SOC analysts
The traditional workflow for a Monday morning check:
- Open the monitoring dashboard, filter alerts by date, scan the table
- Switch to the pipeline view, verify each flow is green
- Open the asset inventory, check entity counts and statuses
- Navigate to the MITRE coverage page, review tactic breakdown
- Cross-reference alerts with affected assets and detection coverage
That is 5 tools, ~15 minutes, and significant cognitive load to build a mental model of your security visibility posture.
With MCP, the same check takes 5 questions, ~2 minutes, and zero context switching. The AI handles the navigation, the querying, and the interpretation. You stay in flow.
For detection engineers
MCP turns SilentPulse into a conversational interface for detection coverage analysis. Instead of building custom reports, you ask:
- “Which asset groups have the highest MITRE impact if they go silent?”
- “Are there any degradation alerts on network devices this week?”
- “Show me all assets in the Domain Controllers OU”
This is especially powerful during incident response, when speed matters and you need to quickly assess whether your detection capabilities were intact during the window of compromise.
For security leaders
A CISO preparing for a board meeting can ask: “Give me a summary of our security monitoring coverage” and get an instant, data-driven answer. Not a slide deck from three weeks ago, but live data from the system of record.
The architecture
┌─────────────┐     MCP Protocol      ┌─────────────────┐
│ Claude Code  │ ◄──── stdio/HTTP ───► │  MCP Server     │
│ Cursor       │                       │  (Go binary)    │
│ Any MCP      │                       │                 │
│ client       │                       │  8 tools        │
└─────────────┘                       │  4 resources    │
                                       └────────┬────────┘
                                                │ SQL
                                       ┌────────▼────────┐
                                       │   PostgreSQL     │
                                       │   + AGE (graph)  │
                                       └─────────────────┘
The MCP server is a single Go binary with no external dependencies beyond PostgreSQL. It compiles to ~15 MB, starts in milliseconds, and uses the same database connection as the main SilentPulse API. No data duplication, no sync lag, no additional infrastructure.
Tenant isolation is enforced at the query level. The MCP_TENANT_ID variable scopes every query to a single tenant. Even in a multi-tenant deployment, the MCP server only sees what the configured tenant owns.
What’s next
The MCP server today covers the core read path: alerts, flows, assets, and MITRE coverage. We are already working on extending it:
- Write operations: acknowledge or resolve alerts via MCP, create exclusion rules, tag assets.
- Time-range queries: “What was my visibility posture last Tuesday at 3 AM?”
- Composite analysis: tools that combine multiple data points into a single answer, like “Which pipelines had the most alerts this month and which assets were most affected?”
- MCP Resources: exposing dashboards, runbooks, and configuration as readable resources for richer AI context.
Try it
If you are running SilentPulse, the MCP server is already included. Set up the .mcp.json, open Claude Code, and start asking questions.
If you are evaluating SilentPulse, spin up the demo environment. It comes pre-loaded with realistic data (15 Windows servers, 5 network devices, 5 cloud workloads, 3 monitoring pipelines, and 74 resolved alerts) so you can see MCP in action immediately.
Your security data has always been there. Now you can just talk to it.