SilentPulse monitors whether your security telemetry is flowing. But who monitors SilentPulse?
Until now, the answer was health checks and logs. Each service exposes /healthz for liveness probes. Kubernetes restarts pods that fail health checks. Logs capture errors. That covers the basics: is the process alive, and did something go wrong.
It does not cover the questions that come up in production:
- How long do worker collection cycles take, and is that duration trending upward?
- How many assets does the scheduler expect vs. how many are actually present?
- What percentage of notifications are failing, and which channel types are affected?
- Is the circuit breaker opening for a specific integration point, and how often?
These are observability questions. They need time-series data, percentile calculations, and visualizations. They need Prometheus and Grafana.
This post walks through the full instrumentation: 14 metrics across 4 services, the design decisions behind each one, and two Grafana dashboards that ship with the Helm chart.
What we instrument and why
SilentPulse has a pipeline architecture. Assets flow through four stages:
CMDB Sync  -->  Worker (collect)  -->  Redis (cache)  -->  Scheduler (evaluate)
                    |                                          |
                    v                                          v
              Integration Point                          Alert + Notify
           (Kafka, Splunk, ES...)
The worker queries external systems (Kafka topic offsets, Splunk searches, Elasticsearch queries) to discover which assets are sending telemetry. The scheduler compares those observed assets against the expected set from the CMDB and creates alerts for anything missing. The notification service dispatches those alerts to Slack, email, webhooks, or PagerDuty.
Each stage has different failure modes and different performance characteristics. A Splunk query takes 2-8 seconds. A Kafka consumer group offset lookup takes 50ms. An Elasticsearch search can take 200ms or 30 seconds depending on the index size and query complexity. We need to see these differences per integration point, not as a system-wide average.
The metrics package
All 14 metrics are defined in a single file: internal/metrics/metrics.go. They use the prometheus/client_golang library and register via init(), which means they’re available to every service that imports the package.
func init() {
    prometheus.MustRegister(
        WorkerCollections,
        WorkerCollectionDuration,
        WorkerAssets,
        WorkerErrors,
        SchedulerEvaluations,
        SchedulerEvaluationDuration,
        SchedulerMissing,
        AlertsCreated,
        AlertsResolved,
        NotificationsSent,
        NotificationFailures,
        CacheOperations,
        CacheLatency,
        HealthStatus,
    )
}
MustRegister panics if a metric name collides with an already-registered metric. This is intentional. A name collision is a programming error, and we want it to crash at startup, not silently produce wrong data at 3 AM.
The /metrics endpoint is served by each service through promhttp.Handler(). The API service exposes it on the main HTTP port. The worker, scheduler, and notification services each run a separate health HTTP server on their own ports (8080, 8081, 9092) that serves both /healthz and /metrics.
One Prometheus instance scrapes all four services. Since Go’s prometheus package uses a global default registry, every service registers all 14 metrics at startup, but each service only records the metrics relevant to its own work. The worker never increments SchedulerEvaluations. The scheduler never touches WorkerCollections. Prometheus scrapes all of them from each target, but only the ones that have been incremented will have non-zero values. Unrecorded metrics return zero, which is correct.
Worker metrics: 4 metrics for the collection pipeline
The worker is where SilentPulse reaches out to external systems. Every collection cycle queries an integration point (Kafka, Splunk, Elasticsearch, syslog, webhook cache, or a custom connector), parses the response, and writes observed assets to Redis.
silentpulse_worker_collections_total
Counter with labels pulse_id and status.
var WorkerCollections = prometheus.NewCounterVec(
    prometheus.CounterOpts{
        Name: "silentpulse_worker_collections_total",
        Help: "Total number of worker collection cycles.",
    },
    []string{"pulse_id", "status"},
)
Every collection cycle ends in exactly one of four states:
| Status | Meaning |
|---|---|
success | Query succeeded, assets written to Redis |
error | Query failed after retries (config error, collection error, or Redis write error) |
circuit_open | Circuit breaker is open, cycle skipped entirely |
quota_blocked | Tenant exceeded observation quota, cycle skipped |
The pulse_id label is the UUID of the flow pulse (the specific point in a monitoring flow). This gives per-pipeline granularity. You can see that your Kafka pulse runs 800 successful collections per hour while your Splunk pulse has a 3% error rate.
The circuit breaker status deserves a note. SilentPulse uses a circuit breaker pattern per integration point. After N consecutive failures, the breaker opens and skips all collection attempts for a cooldown period. This prevents a failing Splunk instance from burning API rate limits or filling log files with repeated errors. When the breaker opens, the worker increments circuit_open instead of error, so you can distinguish “the integration point is down and we’ve stopped trying” from “we tried and failed.”
The recording happens at every exit point in the collection function:
func (c *Collector) runCycle(ctx context.Context) {
    pulseID := c.cfg.FlowPulseID.String()
    start := time.Now()
    defer func() {
        metrics.WorkerCollectionDuration.WithLabelValues(pulseID).
            Observe(time.Since(start).Seconds())
    }()

    if !c.cb.Allow() {
        metrics.WorkerCollections.WithLabelValues(pulseID, "circuit_open").Inc()
        return
    }

    // ... quota check, config load, collection, Redis write ...

    if collectErr != nil {
        metrics.WorkerCollections.WithLabelValues(pulseID, "error").Inc()
        metrics.WorkerErrors.WithLabelValues(pulseID, "collect").Inc()
        return
    }

    metrics.WorkerCollections.WithLabelValues(pulseID, "success").Inc()
    metrics.WorkerAssets.WithLabelValues(pulseID).Set(float64(len(assets)))
}
The defer for duration runs regardless of which exit path we take. A circuit-open skip that returns in 50 microseconds and a 30-second Splunk query both get their duration recorded.
silentpulse_worker_collection_duration_seconds
Histogram with label pulse_id. Uses Prometheus default buckets: .005, .01, .025, .05, .075, .1, .25, .5, .75, 1, 2.5, 5, 7.5, 10 seconds.
We debated custom buckets here. Kafka offset lookups complete in 20-100ms. Splunk searches take 2-15 seconds. A single bucket set can’t provide useful resolution for both. But custom per-integration-type buckets would require the metrics package to know about integration types, which breaks the layering (metrics is a leaf package, connector types are higher up).
We went with default buckets and accepted that Kafka durations will cluster in the first few buckets while Splunk durations will spread across the upper ones. The p50/p95/p99 calculations still work correctly regardless of bucket distribution. And in Grafana, the Pipeline Health dashboard uses a heatmap panel that visualizes the actual distribution, so bucket boundaries matter less.
silentpulse_worker_assets_collected
Gauge with label pulse_id. Set (not incremented) to the number of assets returned by each collection cycle.
This is a gauge, not a counter, because we care about the current value rather than the cumulative total. If your AD pulse normally collects 147 servers and suddenly reports 12, that’s a problem. A counter of total assets collected over time wouldn’t surface this drop because 12 is still a positive increment.
The gauge is set after a successful Redis write:
metrics.WorkerAssets.WithLabelValues(pulseID).Set(float64(len(assets)))On error, the gauge retains its last known value. This is the right behavior: a failed collection doesn’t mean the asset count dropped to zero. The previous value is the best estimate until the next successful cycle.
silentpulse_worker_errors_total
Counter with labels pulse_id and error_type. Three error types: config (failed to load integration point credentials or query configuration), collect (the external system returned an error or timed out), redis (assets collected but couldn’t be written to Redis).
The three types correspond to three distinct failure modes with different remediation paths. A config error usually means a credential rotation broke the integration point. A collect error means the external system is down or overloaded. A redis error is an infrastructure problem in SilentPulse itself. The Grafana dashboard shows these as separate time series so you can see which failure mode is active without grepping logs.
Scheduler metrics: 3 metrics + 2 alert counters
The scheduler compares expected assets (from the CMDB/asset group) against observed assets (from Redis, written by the worker) and decides whether to create, maintain, or resolve alerts.
silentpulse_scheduler_evaluations_total
Counter with labels pulse_id and status. Currently records only success, because the scheduler treats evaluation errors as partial results rather than outright failures (it evaluates as many assets as it can and logs errors for the rest).
silentpulse_scheduler_evaluation_duration_seconds
Histogram with label pulse_id. Same default buckets as the worker duration. Scheduler evaluations are typically faster (10-500ms) because they query Redis and PostgreSQL locally rather than reaching out to external systems. The lower buckets (.005, .01, .025) provide the resolution we need.
silentpulse_scheduler_missing_assets
Gauge with label pulse_id. The key operational metric. This is the number of assets that the CMDB says should be reporting telemetry but that the worker didn’t find in the last collection cycle.
metrics.SchedulerMissing.WithLabelValues(pulseID).Set(float64(missing))In steady state, this gauge should be zero for every pulse. Any non-zero value means the scheduler is either about to create alerts or already has. The Overview dashboard shows this as a time series with threshold coloring: green at 0, amber at 5, red at 20.
silentpulse_alerts_created_total and silentpulse_alerts_resolved_total
Counters recorded by the scheduler when it creates or resolves alerts during evaluation. The created counter has a severity label (currently always info, with warning and critical planned for future severity-based alerting).
The difference increase(alerts_created[1h]) - increase(alerts_resolved[1h]) gives an estimate of net active alerts. The Overview dashboard shows this as a stat panel with threshold coloring.
Notification metrics: 2 metrics for delivery tracking
silentpulse_notifications_sent_total
Counter with labels channel_type and status. The channel_type is the notification channel kind: slack, email, webhook, pagerduty, msteams. The status is success or error.
The dispatcher records this after every send attempt:
if err := sender.Send(ctx, payload); err != nil {
    metrics.NotificationsSent.WithLabelValues(rwc.Channel.Type, "error").Inc()
    metrics.NotificationFailures.WithLabelValues(rwc.Channel.Type).Inc()
    return
}
metrics.NotificationsSent.WithLabelValues(rwc.Channel.Type, "success").Inc()
silentpulse_notification_delivery_failures_total
A separate failure counter with only the channel_type label. This exists so you can compute the delivery success rate without needing a status label filter:
100 * (1 - sum(rate(silentpulse_notification_delivery_failures_total[5m]))
       / clamp_min(sum(rate(silentpulse_notifications_sent_total[5m])), 1))
The clamp_min(..., 1) prevents division by zero when no notifications have been sent.
Cache and health metrics: forward-looking
Three metrics are defined but not yet instrumented: cache_operations_total, cache_latency_seconds, and health_status. These are registered in the global registry and appear on the /metrics endpoint with zero values.
We defined them now because adding a metric to a running Prometheus setup requires updating the scrape config or alert rules if you use metric_relabel_configs. By registering them early, they’ll be present in Prometheus the moment we add instrumentation in a future release, with no scrape config changes needed.
The cache metrics will instrument Redis reads and writes in the worker and scheduler. The health metric will expose the same component health status that /healthz reports, but as a Prometheus gauge that can be visualized alongside other metrics in Grafana and used in alerting rules.
Label cardinality
The most common mistake in Prometheus instrumentation is high-cardinality labels. A label with thousands of unique values (like a user ID or request URL) creates thousands of time series per metric, which inflates Prometheus memory usage and slows down queries.
Our highest-cardinality label is pulse_id. A SilentPulse deployment has one pulse per flow stage per asset group. A typical enterprise deployment might have 5-20 asset groups with 2-4 stages each, producing 10-80 unique pulse IDs. That’s 10-80 time series per metric with a pulse_id label. Manageable.
We specifically avoided labels like asset_id (could be tens of thousands), alert_id (unbounded), or integration_point_name (free-form string). The pulse_id is a UUID, but the cardinality is bounded by the number of configured flow pulses, which is an operator-controlled value.
The channel_type label has 5 possible values. The status label has 2-4 values. The error_type label has 3 values. None of these will surprise your Prometheus instance.
The Grafana dashboards
SilentPulse ships two dashboards as JSON files in deploy/helm/silentpulse/dashboards/. They’re loaded into Grafana automatically via a ConfigMap with the grafana_dashboard: "1" label, which Grafana’s sidecar discovers and imports.
# grafana-dashboards-cm.yaml
apiVersion: v1
kind: ConfigMap
metadata:
  name: silentpulse-grafana-dashboards
  labels:
    grafana_dashboard: "1"
data:
  silentpulse-overview.json: |-
    {{ .Files.Get "dashboards/silentpulse-overview.json" | nindent 4 }}
  pipeline-health.json: |-
    {{ .Files.Get "dashboards/pipeline-health.json" | nindent 4 }}
The ConfigMap is gated by .Values.grafana.dashboards.enabled. If you don’t run Grafana, the ConfigMap isn’t created and the dashboard JSONs aren’t included in the Helm release.
Both dashboards target Grafana 10+ (schemaVersion 39) and use a datasource template variable so they work with any Prometheus datasource name. They also expose a pulse_id multi-select variable populated by label_values(silentpulse_worker_collections_total, pulse_id), so you can filter every panel to a specific pipeline.
Dashboard 1: SilentPulse Overview
14 panels organized in 4 collapsible row sections. This is the “glance at it and know if something is wrong” dashboard.
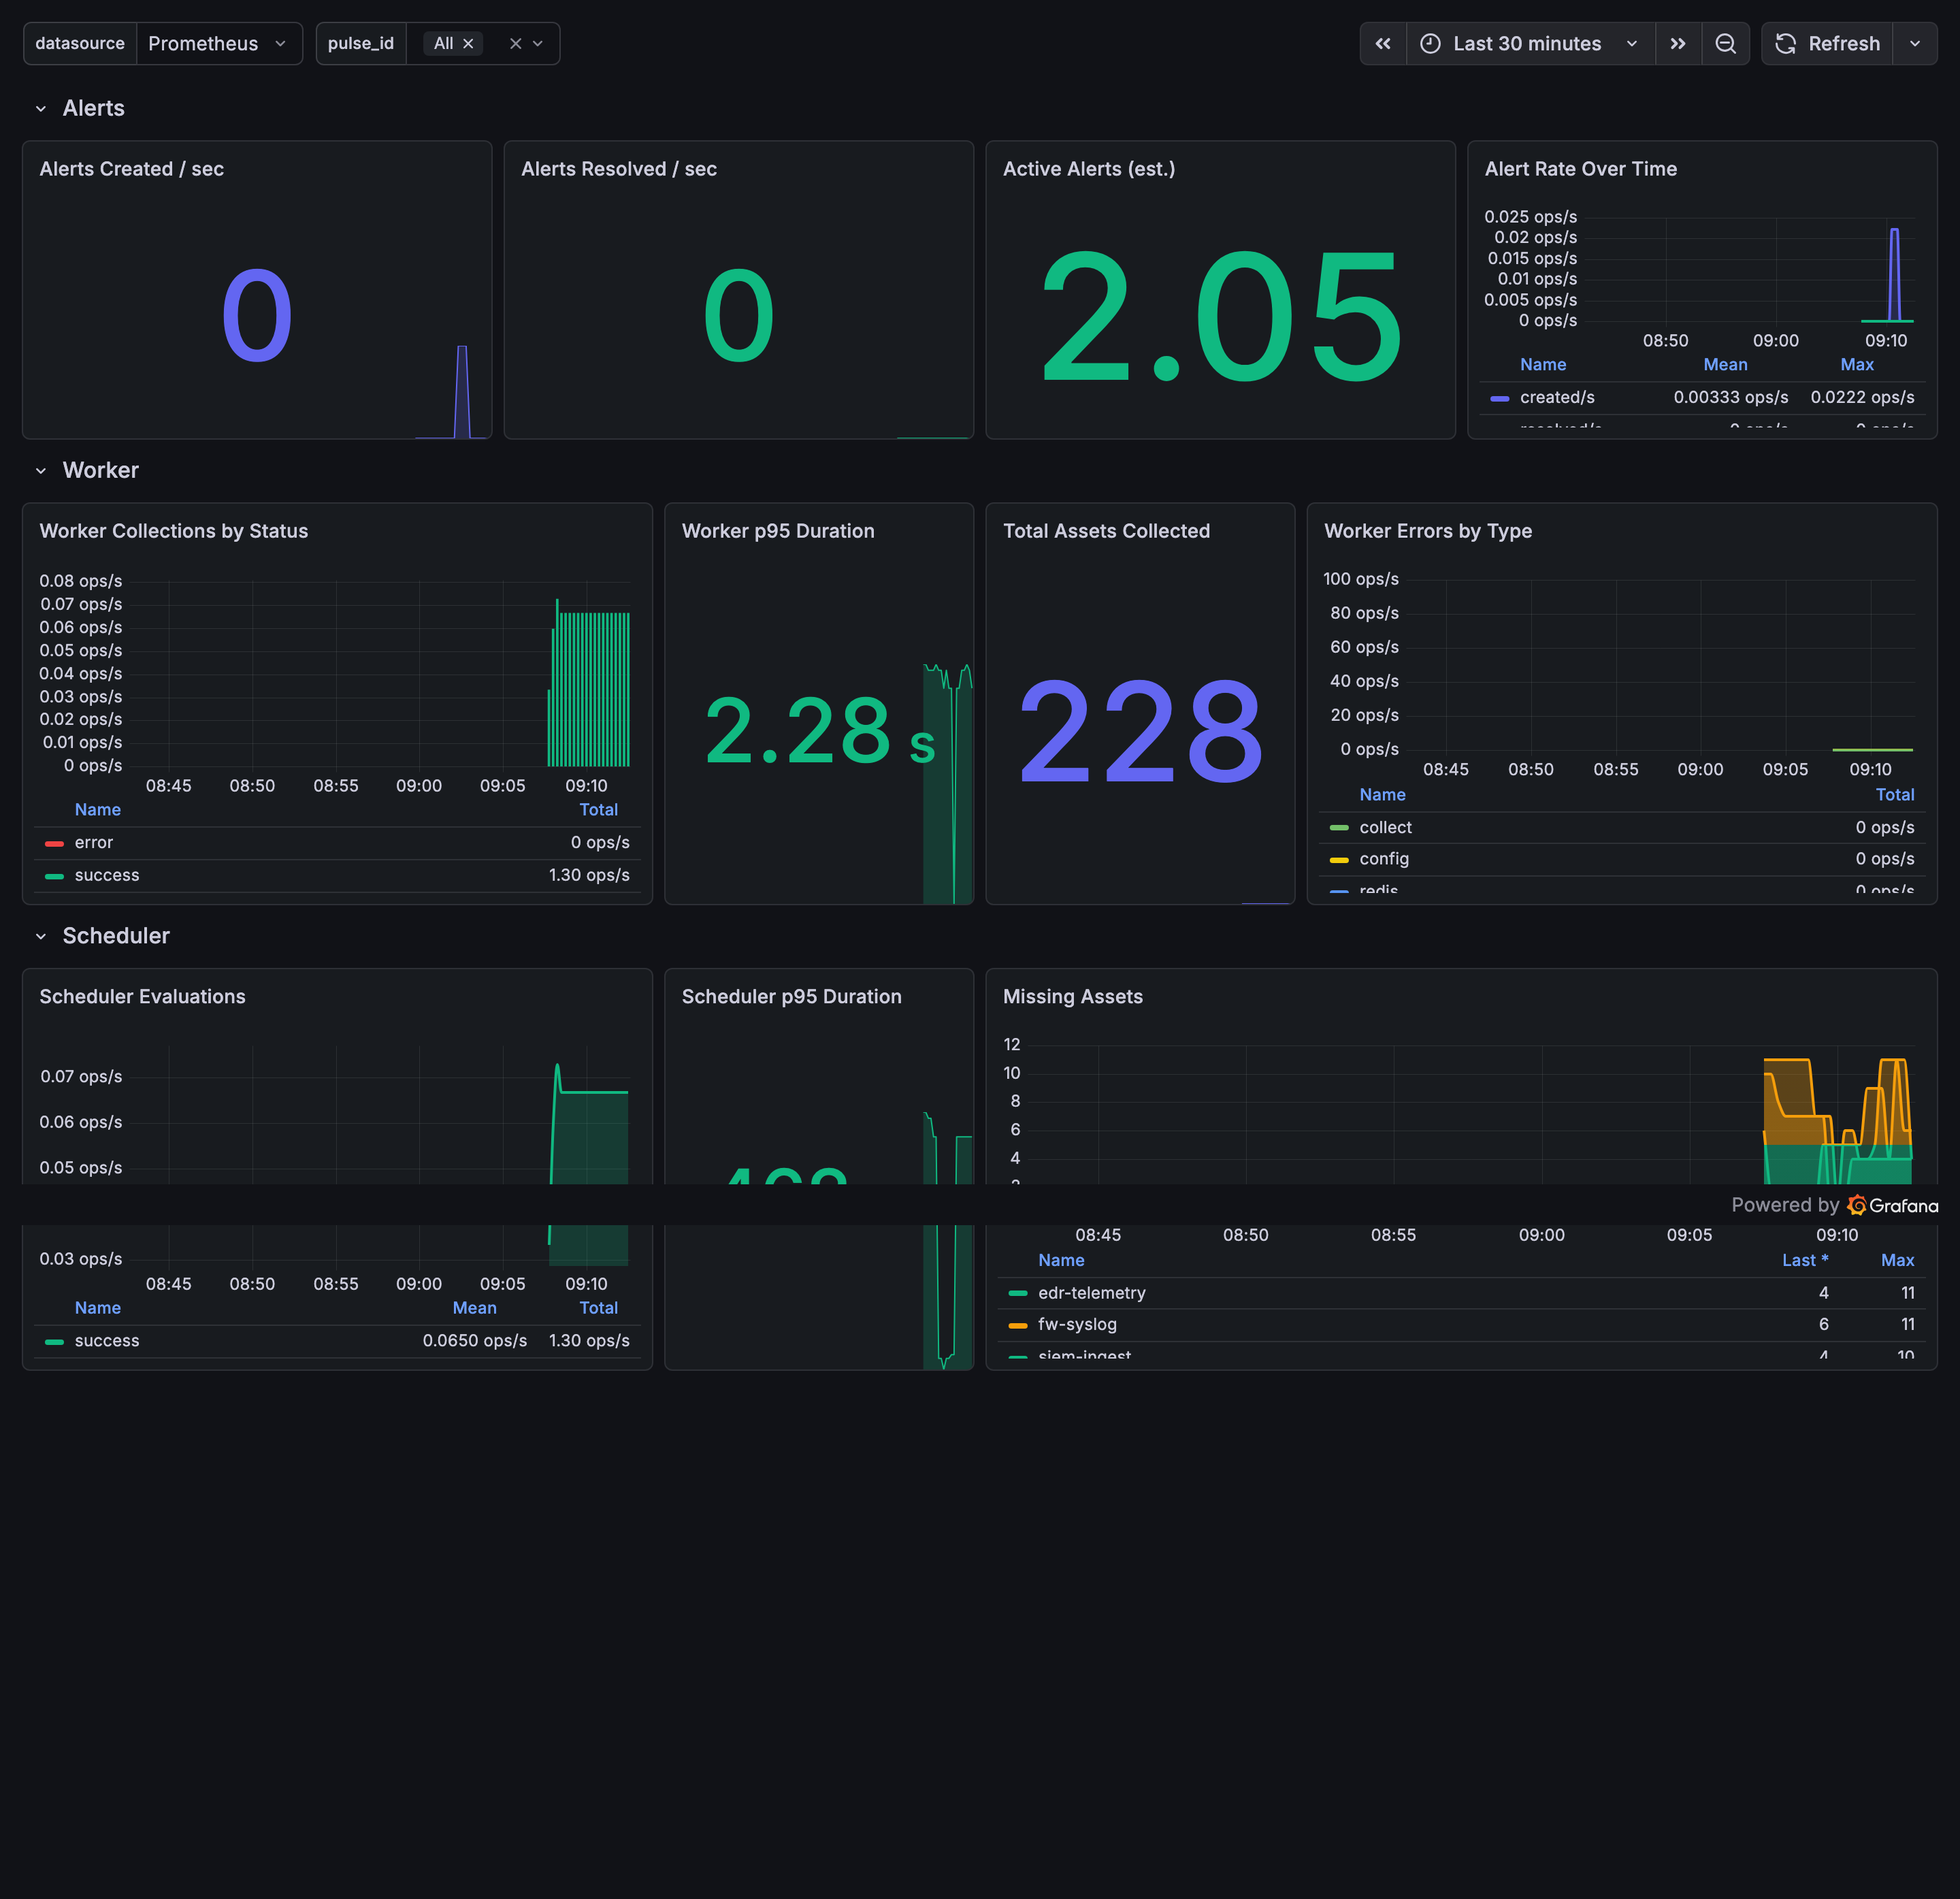
Alerts section (4 panels):
| Panel | Type | Query |
|---|---|---|
| Alerts Created/sec | Stat | sum(rate(silentpulse_alerts_created_total[$__rate_interval])) |
| Alerts Resolved/sec | Stat | sum(rate(silentpulse_alerts_resolved_total[$__rate_interval])) |
| Active Alerts (est.) | Stat | sum(increase(...created[1h])) - sum(increase(...resolved[1h])) |
| Alert Rate Over Time | Time series | Both rates overlaid, indigo vs. emerald |
The Active Alerts panel uses thresholds: green below 10, amber 10-50, red above 50. These are deliberately generous defaults. The point isn’t precision (the SilentPulse UI has exact counts), it’s spotting spikes. If you see 200 estimated active alerts on a dashboard that’s normally green, something broke.
Worker section (4 panels):
| Panel | Type | Query |
|---|---|---|
| Collections by Status | Time series | sum by (status) (rate(...collections_total[$__rate_interval])) |
| Worker p95 Duration | Stat | histogram_quantile(0.95, sum by (le) (rate(...duration_bucket[...]))) |
| Total Assets Collected | Stat | sum(silentpulse_worker_assets_collected) |
| Worker Errors by Type | Time series | sum by (error_type) (rate(...errors_total[...])) |
The Collections by Status panel uses fixed color mapping: success is emerald, error is red, circuit_open is amber, quota_blocked is purple. When a circuit breaker opens for a Splunk integration point, the amber series rises and the success series drops. When it closes again, the pattern reverses. You can see the breaker’s cooldown period as the gap between the amber spike and the return to green.
The p95 duration stat has thresholds at 5 seconds (amber) and 30 seconds (red). If p95 crosses 30 seconds, collection cycles are timing out or the external system is severely degraded.
Scheduler section (3 panels):
| Panel | Type | Query |
|---|---|---|
| Scheduler Evaluations | Time series | sum by (status) (rate(...evaluations_total[...])) |
| Scheduler p95 Duration | Stat | histogram_quantile(0.95, ...) |
| Missing Assets | Time series | sum by (pulse_id) (silentpulse_scheduler_missing_assets) |
The Missing Assets panel is the most operationally important panel on the dashboard. Each line represents a pulse ID, and a line above zero means that pulse has assets that should be reporting but aren’t. The panel uses threshold-based coloring: green at 0, amber at 5, red at 20. A pulse that goes from 0 to 47 missing assets in a single evaluation cycle is immediately visible as a red spike.
Notification section (3 panels):
| Panel | Type | Query |
|---|---|---|
| Notifications by Channel | Time series | sum by (channel_type) (rate(...sent_total[...])) |
| Notification Failures | Time series | sum by (channel_type) (rate(...failures_total[...])) |
| Delivery Success Rate | Gauge | 100 * (1 - failures / clamp_min(sent, 1)) |
The Success Rate gauge is a radial gauge with three zones: red (0-90%), amber (90-99%), green (99-100%). A rate below 99% in production deserves investigation. Below 90% means you’re losing 1 in 10 alert notifications and analysts aren’t hearing about visibility gaps.
Dashboard 2: Pipeline Health
8 panels, all filterable by pulse_id. This is the “drill into a specific pipeline” dashboard.
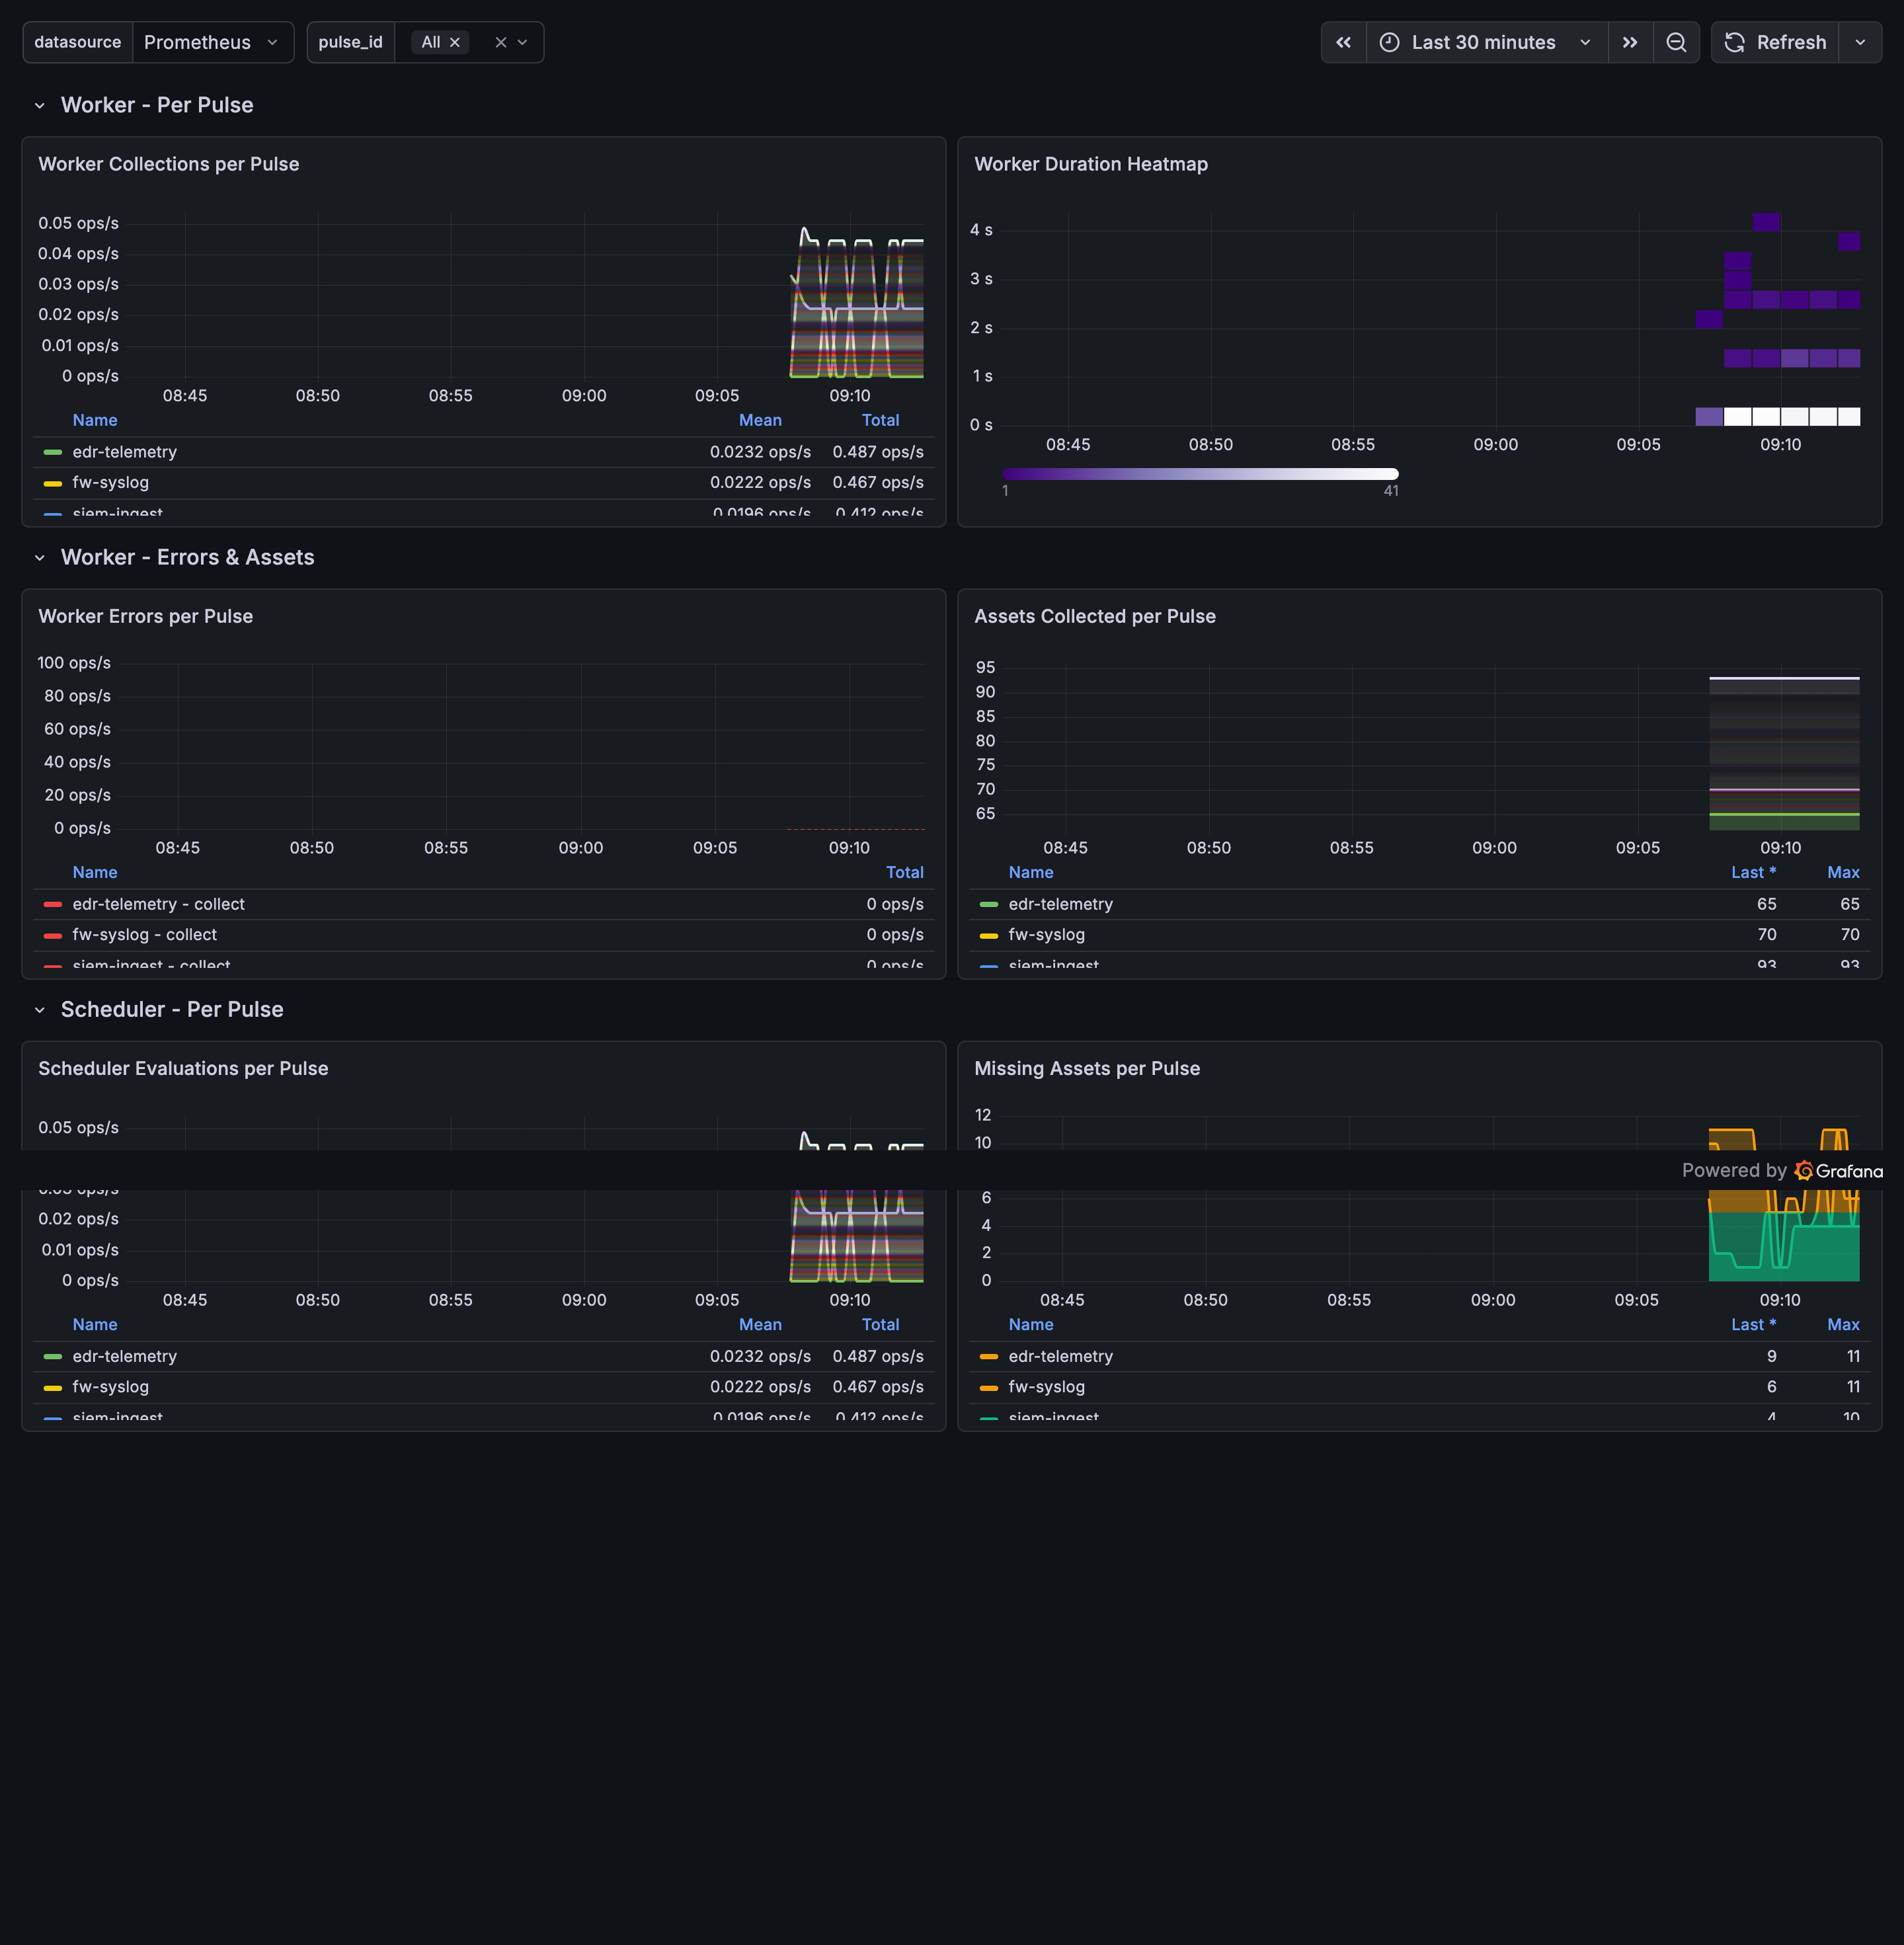
The standout panel is the Worker Duration Heatmap. It uses increase(silentpulse_worker_collection_duration_seconds_bucket[...]) with an exponential color scale to show how collection durations distribute over time. A healthy pipeline shows a tight band at a consistent latency. A degrading pipeline shows the band spreading upward and the color shifting to higher buckets.
The heatmap uses the Purples color scheme and log base 2 scaling. The exponential scale prevents a single slow query from washing out the visualization. A pipeline that normally completes in 200ms but occasionally hits 5 seconds will show the 200ms band in deep purple and the 5-second outliers in light purple, both visible simultaneously.
The Cache Operations and Cache Latency panels are present but will show empty until the cache instrumentation lands. We included them in the dashboard now so operators don’t need to re-import the dashboard JSON when cache metrics go live.
PromQL patterns worth noting
A few of the dashboard queries use patterns that are easy to get wrong.
![Grafana Explore view with rate(silentpulse_worker_collections_total[5m]) query showing per-pulse collection rates](/images/grafana-explore.png)
Rate interval alignment. Every rate() and increase() call uses $__rate_interval instead of a hardcoded duration like [5m]. Grafana’s $__rate_interval automatically adjusts to max(4 * scrape_interval, step), which prevents the “no data” problem that occurs when the rate window is smaller than two scrape intervals. If your Prometheus scrapes SilentPulse every 15 seconds, $__rate_interval resolves to 60 seconds. If you scrape every 60 seconds, it resolves to 4 minutes. The queries work correctly regardless of your scrape configuration.
Histogram quantile aggregation. The p95 queries aggregate across all pulse IDs before computing the quantile:
histogram_quantile(0.95,
    sum by (le) (rate(silentpulse_worker_collection_duration_seconds_bucket[$__rate_interval]))
)
The sum by (le) merges the bucket counts across all pulse IDs, then histogram_quantile computes a single p95. This gives the system-wide p95. The Pipeline Health dashboard does the same query but filtered to pulse_id=~"$pulse_id", giving a per-pipeline p95 when you select a specific pulse.
Division by zero protection. The notification success rate query uses clamp_min(..., 1):
100 * (1 - sum(rate(notification_delivery_failures_total[$__rate_interval]))
       / clamp_min(sum(rate(notifications_sent_total[$__rate_interval])), 1))
Without clamp_min, a period with zero notifications sent would produce 0/0 = NaN, which Grafana renders as “No data.” With clamp_min, zero notifications produces 1 - 0/1 = 100%, which is semantically correct: if you sent nothing and nothing failed, your success rate is 100%.
Branding
Both dashboards use SilentPulse’s brand colors:
| Element | Color | Hex |
|---|---|---|
| Primary metrics (rates, durations) | Indigo | #6366F1 |
| Success states (resolved, healthy) | Emerald | #10B981 |
| Error states | Red | #EF4444 |
| Warning states (circuit open) | Amber | #F59E0B |
| Quota/special states | Purple | #8B5CF6 |
These match the colors used in the SilentPulse UI, so patterns you see in Grafana correspond visually to what you see in the product dashboard.
Deploying
If you already run Grafana with sidecar dashboard discovery (the standard setup in kube-prometheus-stack), enable dashboards in your Helm values:
grafana:
  dashboards:
    enabled: true
The ConfigMap will be created with the grafana_dashboard: "1" label. Grafana’s sidecar picks it up and imports both dashboards automatically.
For Prometheus scraping, add scrape targets for each SilentPulse service. If you use ServiceMonitor CRDs (from the Prometheus Operator), point them at the service ports. If you use static config:
scrape_configs:
  - job_name: silentpulse-api
    static_configs:
      - targets: ['silentpulse-api:8090']
  - job_name: silentpulse-worker
    static_configs:
      - targets: ['silentpulse-worker:8080']
  - job_name: silentpulse-scheduler
    static_configs:
      - targets: ['silentpulse-scheduler:8081']
  - job_name: silentpulse-notifications
    static_configs:
      - targets: ['silentpulse-notifications:9092']
Metrics are enabled by default (METRICS_ENABLED=true). The endpoint path defaults to /metrics but can be changed via METRICS_PATH if it conflicts with your existing routing.
What’s next
Three metrics are defined and registered but not yet instrumented: cache_operations_total, cache_latency_seconds, and health_status. The cache metrics will land in the next release with Redis operation tracking. The health status gauge will mirror the /healthz endpoint so you can set Prometheus alerting rules on component health rather than relying solely on Kubernetes liveness probes.
We’re also planning a ServiceMonitor CRD in the Helm chart so that Prometheus Operator users get scrape targets configured automatically, with no manual scrape_configs needed.
Prometheus metrics and Grafana dashboards are available now. Update your Helm chart and enable grafana.dashboards.enabled in your values to get started.